
Best & Worst Weekly ADR Report - June 1, 2015
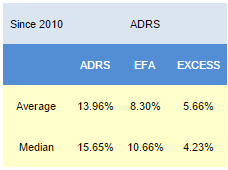
Since 2010, the best scoring ADRs have outpaced the EFA by an average 5.66% in the following year. The best scoring ADRs from one year ago outperformed the EFA by 9.61% in the past year.
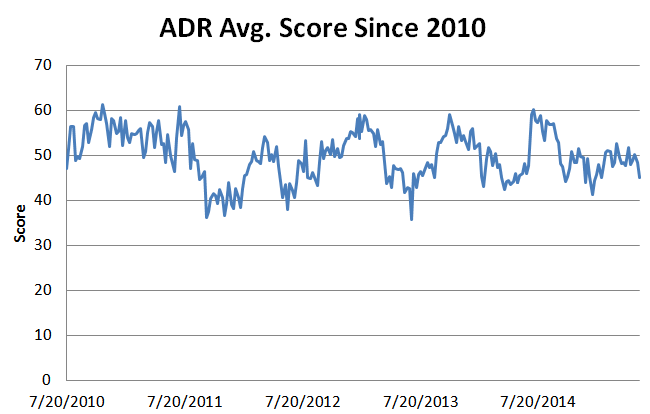
The average ADR score is 45.07, which is below the four and eight week average score of 48.11 and 48.52, respectively. The following chart shows the ADR universe average score since 2010.
The average ADR is trading -22.46% below its 52 week high, 0.36% above its 200 dma, has 3.81 days to cover held short, and is expected to post EPS growth of 11.84% in the coming year. The following are the best and worst scoring ADRs in our universe.
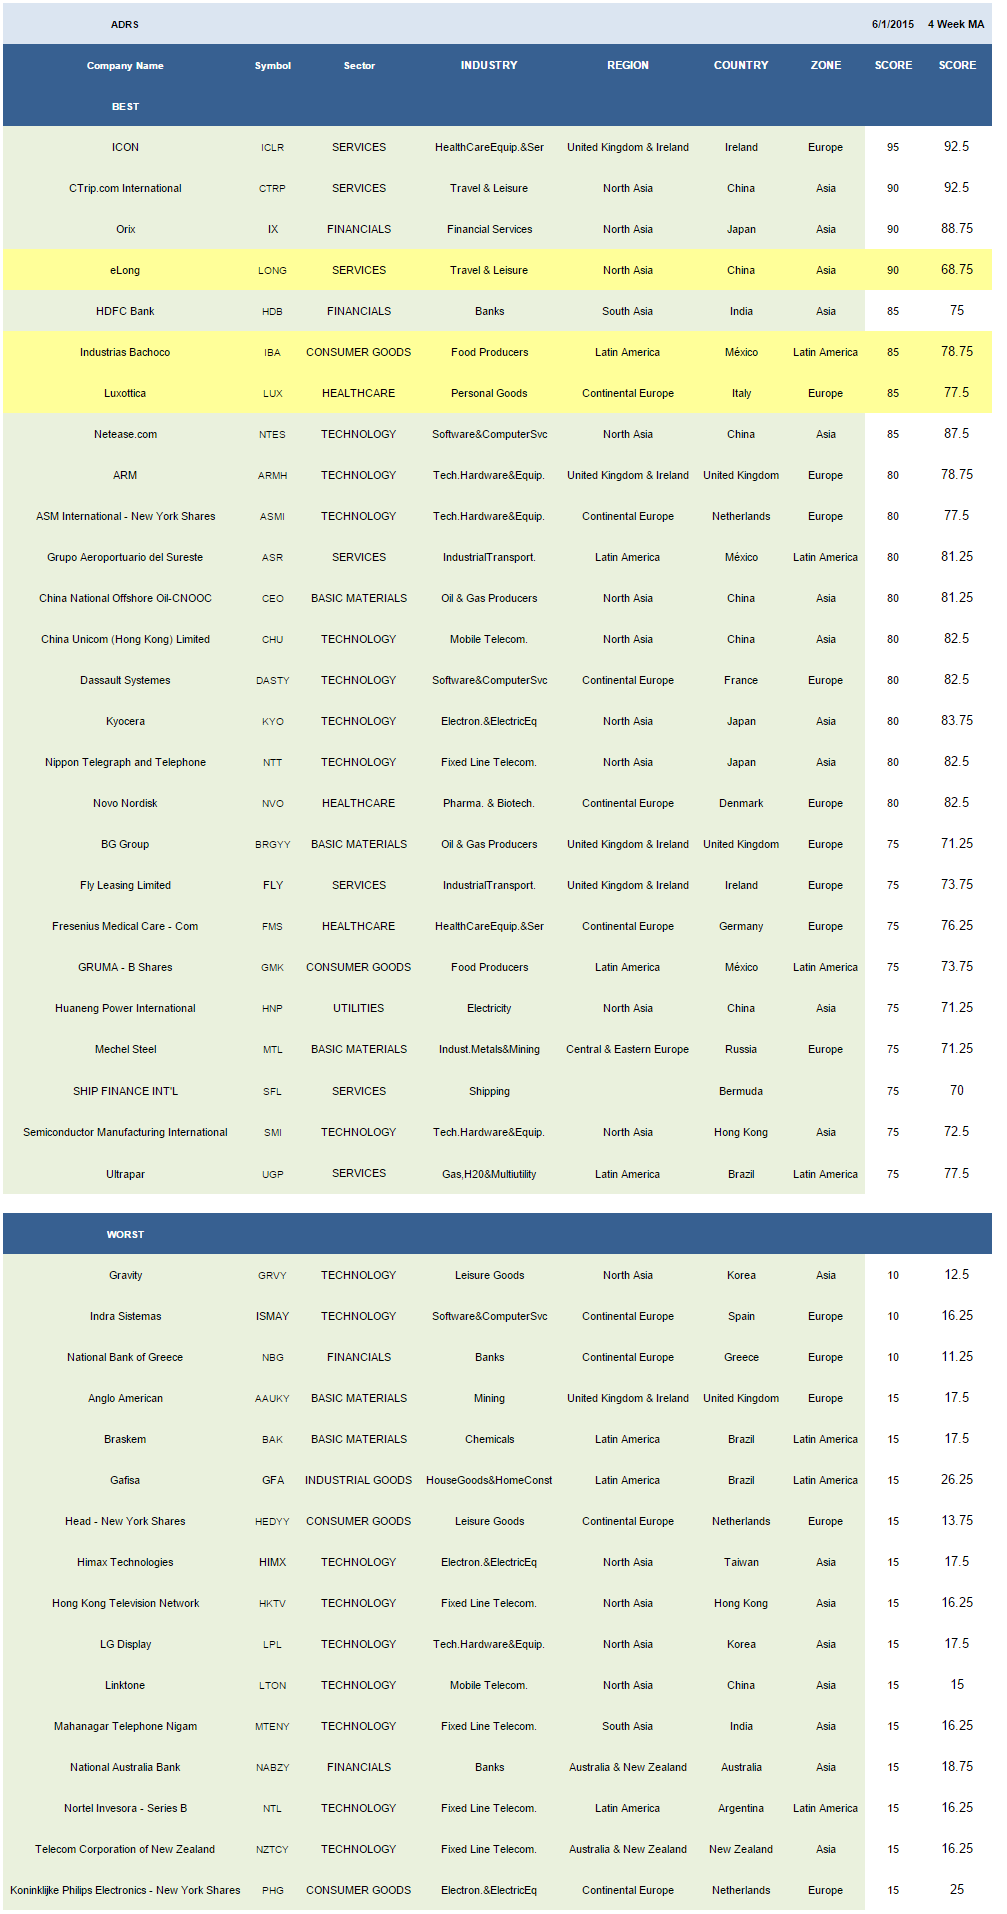
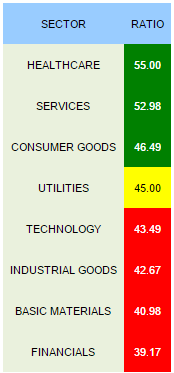
The top scoring sector across ADRs is healthcare (LUX, NVO, FMS, WX, RHHBY). Services (ICLR, LONG, CTRP, ASR, UGP, SFL, FLY, ANW), and consumer goods (IBA, GMK, NSANY, HMC, KKPNY) also score above average. Utilities score in line. Technology, industrials, basics, and financials score below average.
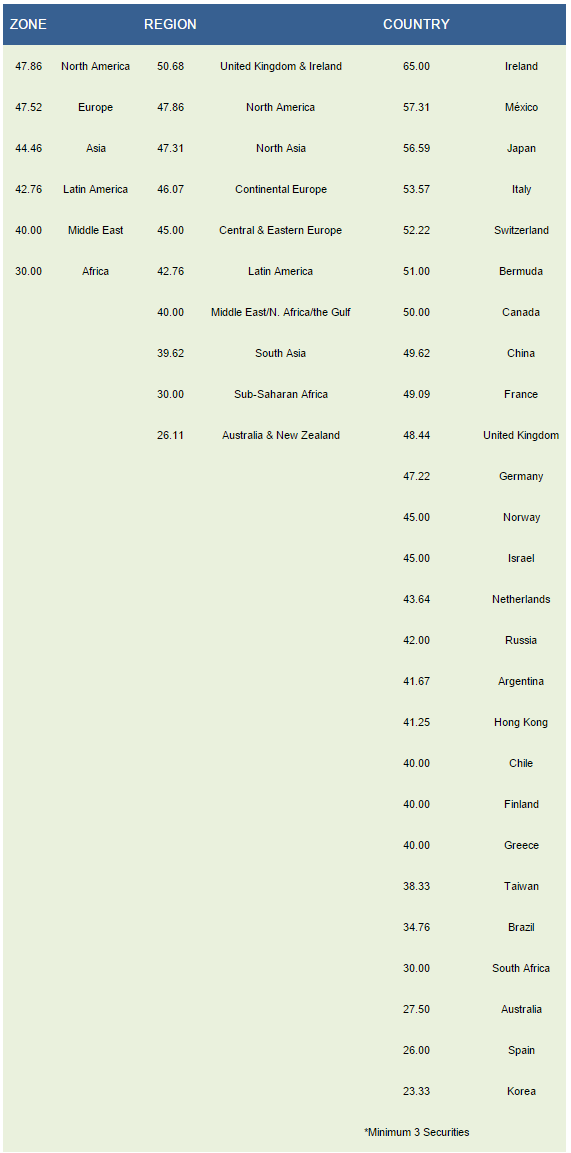
The best scoring zones are North America (BCE, TU, ECA) and Europe (ICLR, LUX, DASTY, ASMI, ARMH, NVO, FLY, FMS, MTL, BRGYY). The top regions are UK/Ireland (ICLR, ARMH, FLY, BRGYY), North America, and North Asia (LONG, CTRP, IX, NTES, NTT, KYO, CHU, CEO, HNP, SMI). The best countries are Ireland (ICLR, FLY, RYAAY), Mexico (IBA, ASR, GMK), Japan (IX, NTT, KYO, NSANY, HMC), Italy (LUX, TI), and Switzerland (LOGI, RHHBY, SYT).
Disclosure: None.


Sorry but what's your point? buy the best ADR's and get a better return? In the last paragraph, how did you pick the stocks in paratheses? In NA BCE TU and ECA? were these the best ADR's in what year?