
Bearish Sign For The Market
- SPX Monitoring purposes; Covered short SPX 1/31/17 at 2278.87 =.09% gain; Short on 1/30/17 at 2280.90
- Monitoring purposes Gold: Long GDX on 12/28/16 at 20.25.
- Long Term Trend monitor purposes: Short SPX on 1/13/16 at 1890.28
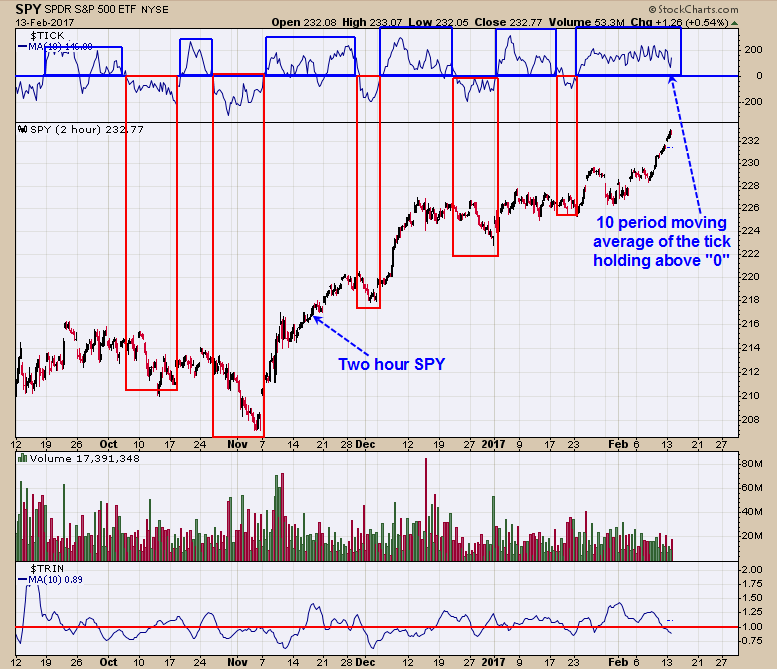
We showed this chart on Friday and are updated to today’s close which is the two hour SPY with a 10 period moving average of the tick. As you can see the 10 period of the tick remains above “0” and suggests a bullish trend in the SPY for now. This can change quickly but as for today’s close the trend is still up according the moving average of the tick. The Total put call ratio is giving a bearish sign for the market with a close of .63 today. We will keep our powder dry for now.
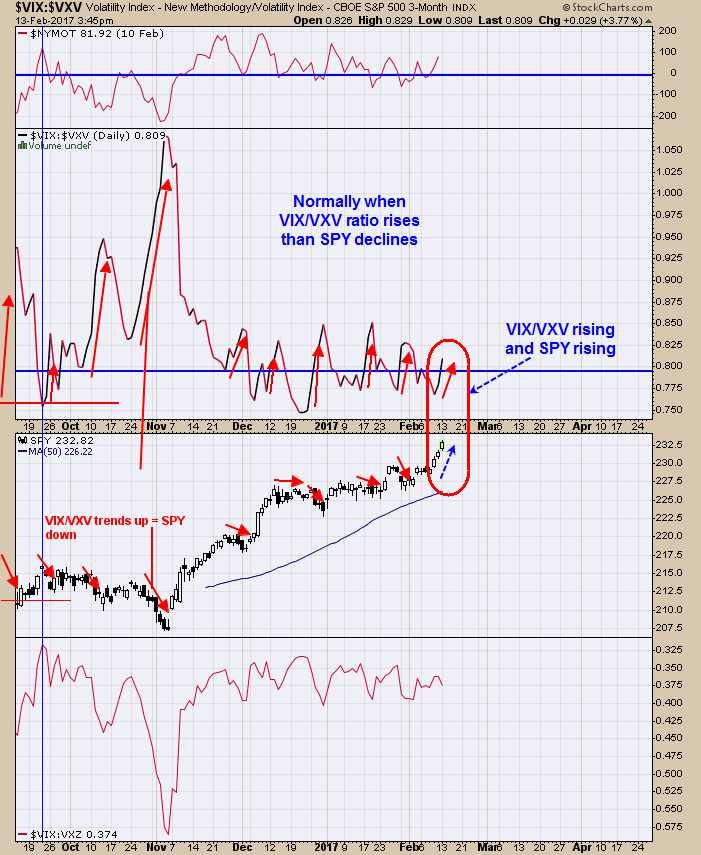
The top window is the NYSE McClellan Oscillator and when above “0” is considered bullish; today’s reading 89.51. Next window down is the VIX/VXV ratio. When this ratio rises than normally the SPY is declining. This ratio has risen the last three days as the SPY has rallied the last three days suggesting one of them is wrong. Not all indicators work all the time and it may that VIX/VXV is not working right now; though it is giving a bearish sign. From our estimate the Total put/call ratio (CPC) stands at .63. CPC less than .70, the SPY closed lower 85% of the time in the next five days on average .7%, therefore the upside is very limited. February 20 is a holiday and a lot of the time can market reversal in the market. For very short term the trend is up but there are divergences.
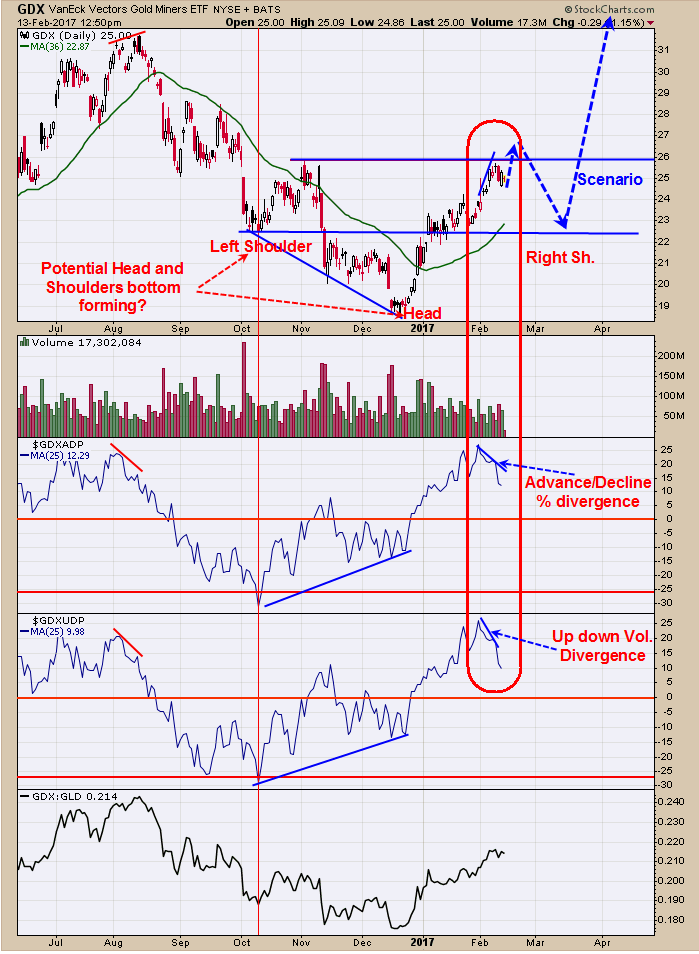
A divergence has showed up both in the Advance/Decline percent and Up down Volume Percent for the short term. There is minor resistance at the November higher near 26.00 and GDX has stalled at this resistance level. GDX has not touched that level yet and most likely will in the coming days. When and if this resistance level is touched or exceeded and the divergence is still present we may exit our long position for a possible retracement down to support near 22.50 range. We don’t won’t to get ahead of ourselves but a potential Head and Shoulders pattern may be forming here; more on that later if more evidence is obtained on the potential pull back. Long GDX on 12/28/16 at 20.25.


