
BEA Revises 3rd Quarter 2017 GDP Growth Upward To 3.30%
In their second estimate of the US GDP for the third quarter of 2017, the Bureau of Economic Analysis (BEA) reported that the US economy was growing at a +3.30% annual rate, up +0.32% from the previous estimate and up +0.24% from the prior quarter.
The changes from the prior estimate reflect higher commercial fixed investment, higher inventory growth, more governmental spending and improved foreign trade. Consumer spending was essentially neutral. The BEA's "bottom line" (their "Real Final Sales of Domestic Product", which excludes inventories) increased to +2.50%, down -0.44% from the prior quarter.
Real annualized household disposable income dropped another -$63 to $39,217 (in 2009 dollars). The household savings rate also dropped another -0.1% to 3.3%, the lowest level since the fourth quarter of 2007.
For this revision, the BEA assumed an effective annualized deflator of 2.12%. During the same quarter (July 2017 through September 2017) the inflation recorded by the Bureau of Labor Statistics (BLS) in their CPI-U index was 4.31%. Underestimating inflation results in optimistic growth rates, and if the BEA's "nominal" data was deflated using CPI-U inflation information the headline growth number would have been materially lower at an +1.19% annualized growth rate.
Among the notable items in the report :
-- The headline contribution from consumer expenditures for goods was reported to be slightly weaker at +0.89% (down -0.27% from the prior quarter).
-- The contribution to the headline from consumer spending on services was essentially static at +0.71% (down -0.38% from the prior quarter). The combined consumer contribution to the headline number was +1.62%, down -0.62% from 2Q-2017.
-- The headline contribution from commercial private fixed investments increased to +0.39%, up +0.14 from the previous estimate but still down -0.14% from the prior quarter. That continued to reflect a contraction in residential construction.
-- Inventory growth provided a material boost to the headline number (+0.80%). This was a +0.68% improvement from the prior quarter. It is important to remember that the BEA's inventory numbers are exceptionally noisy (and susceptible to significant distortions/anomalies caused by commodity price or currency swings) while ultimately representing a zero reverting (and long-term essentially zero-sum) series.
-- Governmental spending was reported to be growing at a +0.07% rate. This was a +0.10% improvement from the prior quarter.
-- Exports contributed +0.27% to the headline number, down -0.15% from the prior quarter.
-- Imports added +0.17% to the headline, which was up +0.39% from the prior quarter. In aggregate, foreign trade added +0.44% to the headline number.
-- The "real final sales of domestic product" grew at an annualized 2.50%, down -0.44% from the prior quarter. This is the BEA's "bottom line" measurement of the economy and it excludes the inventory data.
-- As mentioned above, real per-capita annual disposable income reportedly dropped -$63 per annum. At the same time the household savings rate was reported to have dropped to 3.3% (down -0.4% from the prior quarter). It is important to keep this line item in perspective: real per-capita annual disposable income is up only +6.93% in aggregate since the second quarter of 2008 -- a meager annualized +0.73% growth rate over the past 37 quarters.
The Numbers, as Revised
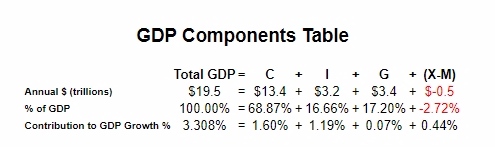
As a quick reminder, the classic definition of the GDP can be summarized with the following equation :
GDP = private consumption + gross private investment + government spending + (exports-imports)
or, as it is commonly expressed in algebraic shorthand :
GDP = C + I + G + (X-M)
In the new report the values for that equation (total dollars, percentage of the total GDP, and contribution to the final percentage growth number) are as follows :
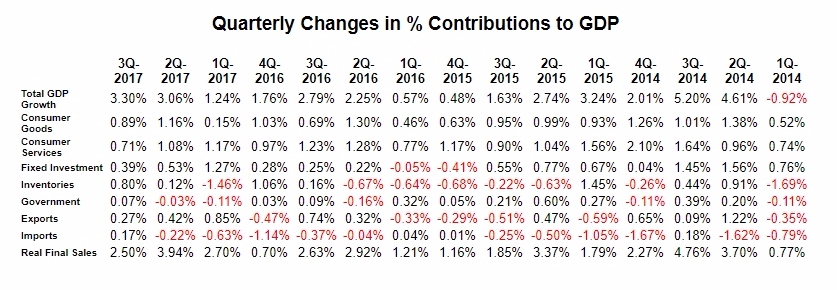
The quarter-to-quarter changes in the contributions that various components make to the overall GDP can be best understood from the table below, which breaks out the component contributions in more detail and over time. In the table below we have split the "C" component into goods and services, split the "I" component into fixed investment and inventories, separated exports from imports, added a line for the BEA's "Real Final Sales of Domestic Product" and listed the quarters in columns with the most current to the left :
Summary and Commentary
The improved headline growth rate comes from upward revisions to commercial fixed investment and inventories. Consumer activity did not materially impact this revision. The notable takeaways from this report are:
-- Inventory growth is again distorting the headline.
-- Household disposable income took another hit. Less money was available, and less money was saved -- so that a significant portion of the already softening consumer spending came from savings, not paychecks.
A happy headline number that results from inventory buildups and consumer spending from diminished savings merits at least some caution, particularly whilst listening to the ongoing "growing economy" narrative that fully anticipates a banner holiday spending season.
Disclosure: None


