
BEA Revises 2nd Quarter 2016 GDP Growth Downward To 1.09% - August 26, 2016
In their second estimate of the US GDP for the second quarter of 2016, the Bureau of Economic Analysis (BEA) reported that the growth rate was +1.09%, down -0.12% from their previous estimate but up +0.26% from the prior quarter. None of the revisions was statistically significant, with the largest line item revision (governmental spending) changing by a mere -0.11%.
The ongoing trend of commercial weakness offset by consumer spending growth was confirmed. This estimate reported continued slow contraction in commercial fixed investment (-0.42%), inventories (-1.26%) and governmental spending (-0.27%). Meanwhile consumer spending on goods (+1.52% growth) and services (+1.42%) remained strong.
The BEA's treatment of inventories can introduce noise and seriously distort the headline number over short terms -- which the BEA admits by also publishing a secondary headline that excludes the impact of inventories. The BEA's "bottom line" (their "Real Final Sales of Domestic Product") was a +2.35% growth rate, up 1.11% from 1Q-2016.
Real annualized household disposable income was revised upward $101 in this report, to an annualized $38,995 (in 2009 dollars). The household savings rate was also revised upward to 5.7% (which is still down from a 6.1% savings rate in the prior quarter).
For this revision the BEA assumed an effective annualized deflator of 2.32%. During the same quarter (April 2016 through June 2016) the inflation recorded by the Bureau of Labor Statistics (BLS) in their CPI-U index was 3.42%. Under estimating inflation results in correspondingly optimistic growth rates, and if the BEA's "nominal" data was deflated using CPI-U inflation information the headline growth number would have been significantly lower, at a miniscule +0.01% rate.
Among the notable items in the report :
-- The headline contribution from consumer expenditures for goods improved to a +1.52% growth rate (representing a +1.27% improvement from the prior quarter).
-- The contribution to the headline from consumer spending on services also improved to +1.42% (up +0.56% from the prior quarter). The combined consumer contribution to the headline number was +2.94%, up +1.83% from 1Q-2016.
-- The headline contribution from commercial private fixed investments remained negative at -0.42%, down -0.27% from the prior quarter.
-- The contribution from inventories remained negative, subtracting -1.26% from the headline number, down -0.85% from 1Q-2016. It bears repeating that the BEA's inventory numbers are exceptionally noisy, subject to significant distortions/anomalies caused by commodity price swings while representing a zero reverting (and long term zero sum) series.
-- The contribution from governmental spending softened, subtracting -0.27% from the headline. This weakening was entirely due to decreased capital spending at state and local levels, with Federal spending essentially flat.
-- The contribution to the headline number from exports was positive at +0.14% (up +0.23% from the prior quarter).
-- Imports subtracted -0.04% from the headline number, down -0.13% from the prior quarter.
-- The "real final sales of domestic product" weakened slightly to +2.35%, which is still up +1.11% from the prior quarter. This is the BEA's "bottom line" measurement of the economy and it excludes the reported inventory contraction.
-- As mentioned above, real per-capita annual disposable income was revised upward $101 in this report (and is now up $151 from the prior quarter), and the household savings rates was also revised upward. Although the household savings rate was revised upward in this report, it is still down from the prior quarter -- and most of the increased quarter-to-quarter consumer spending came from that decreased savings rate. It remains important to keep this line item in perspective. Real per-capita annual disposable income is up only +6.32% in aggregate since the second quarter of 2008 -- a meager annualized +0.77% growth rate over the past 32 quarters.
The Numbers, As Revised
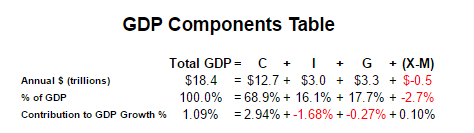
As a quick reminder, the classic definition of the GDP can be summarized with the following equation :
GDP = private consumption + gross private investment + government spending + (exports - imports)
or, as it is commonly expressed in algebraic shorthand :
GDP = C + I + G + (X-M)
In the new report the values for that equation (total dollars, percentage of the total GDP, and contribution to the final percentage growth number) are as follows :
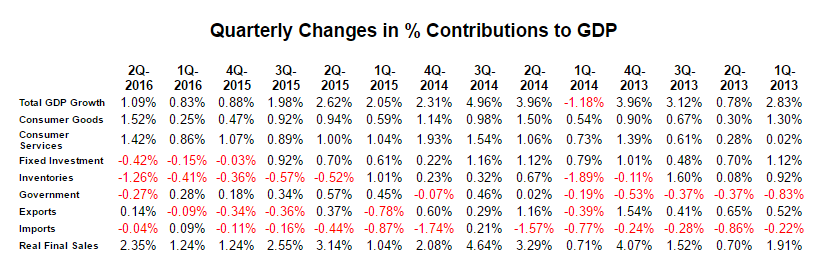
The quarter-to-quarter changes in the contributions that various components make to the overall GDP can be best understood from the table below, which breaks out the component contributions in more detail and over time. In the table below we have split the "C" component into goods and services, split the "I" component into fixed investment and inventories, separated exports from imports, added a line for the BEA's "Real Final Sales of Domestic Product" and listed the quarters in columns with the most current to the left :
Summary and Commentary
Arguably this report was merely statistical noise. It continued to show a US economy moving forward, but with a decidedly lack-luster 1.09% growth rate.
The key items in this report:
-- All things not consumer either weakened or remained in contraction.
-- Consumer spending growth improved yet again, with most of that coming from savings.
-- All of the reported growth disappears when a third party deflator (the BLS CPI-U) is applied to the data.
Once again a mildly positive report masked considerable commercial weakness. We wouldn't expect any other kind of report until the election is put to bed.


