
BEA Revises 1st Quarter 2017 GDP Growth Upward To 1.42% - Thursday, June 29
In their third and final estimate of the US GDP for the first quarter of 2017, the Bureau of Economic Analysis (BEA) revised the growth of the US economy upward to a +1.42% annual rate, up +0.26% from their previous estimate for the first quarter but still down over a half percent (-0.66%) from the +2.08% reported for the fourth quarter of 2016.
Weak consumer spending grew at a meager +0.75% annualized rate during the quarter, up +0.31 from the previous estimate but still down a significant -1.65% from the prior quarter. The previously reported inventory contraction worsened slightly to a -1.11% annual pace (a swing of -2.12% from the prior quarter). Although government spending was revised upward +0.04%, it still contracted during the quarter, removing -0.16% from the headline.
The good news continued to be commercial fixed investment, which although revised downward -0.14% is still now adding +1.71% to the headline. Foreign trade was also revised upward slightly (+0.09%) to a +0.23% contribution to the headline number, up some +2.05% from the prior quarter.
The BEA's "bottom line" (their "Real Final Sales of Domestic Product", which excludes the contracting inventories) was more than a full percent better than the headline at +2.53%, up +1.46% from the 1.07% rate recorded 4Q-2016.
Real annualized household disposable income was essentially unchanged at an annualized $39,360 (in 2009 dollars). The household savings rate was revised -0.1% lower to 5.1%.
For the fourth quarter the BEA assumed an effective annualized deflator of 1.94%. During the same quarter (January 2017 through March 2017) the inflation recorded by the Bureau of Labor Statistics (BLS) in their CPI-U index was lower at 1.54%. Over estimating inflation results in pessimistic growth rates, and if the BEA's "nominal" data was deflated using CPI-U inflation information the headline growth number would have been somewhat higher at a +1.84% annualized growth rate.
Among the notable items in the report :
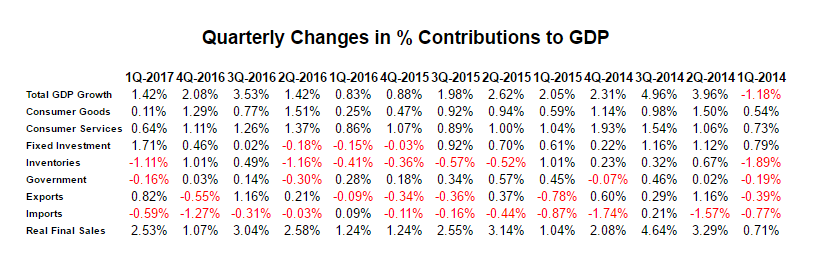
-- The headline contribution from consumer expenditures for goods was still a miniscule +0.11% growth rate (down -1.18% from the prior quarter).
-- The contribution to the headline from consumer spending on services strengthened as it was revised upward +0.27% to +0.64% (although that was down -0.47% from the prior quarter). The entirety of the increase came in upward revisions to the costs of healthcare and insurance (+0.38%). The combined consumer contribution to the headline number was +0.75%, down -1.65% from 4Q-2016.
-- The headline contribution from commercial private fixed investments was revised downward -0.14% to +1.71%, although that remained +1.25% higher than the prior quarter. That growth was primarily in non-residential construction.
-- Inventory contraction deducted -1.11% from the headline number, a downward revision of -0.04% from the previous estimate and down -2.12% from the prior quarter. It is important to remember that the BEA's inventory numbers are exceptionally noisy (and susceptible to significant distortions/anomalies caused by commodity price or currency swings) while ultimately representing a zero reverting (and long term essentially zero sum) series.
-- Governmental spending was still reported to be contracting, although at a revised lower annual rate (at -0.16%, down -0.19% from the prior quarter).
-- Exports were revised upward +0.13% to a +0.82% contribution to the headline, a +1.37% improvement from the prior quarter.
-- Imports were revised downward (-0.04%), and they subtracted -0.59% from the headline number (up +0.68% from the prior quarter). In aggregate, foreign trade added +0.23% to the headline number after subtracting -1.82% during the prior quarter.
-- The "real final sales of domestic product" grew at an annualized 2.53%, up +0.30% from the previous estimate and up +1.46% from the prior quarter. This is the BEA's "bottom line" measurement of the economy and it excludes the reported inventory contraction.
-- As mentioned above, real per-capita annual disposable income was essentially unchanged. At the same time the household savings rate was revised downward again by -0.1%. It is important to keep this line item in perspective: real per-capita annual disposable income is up only +7.32% in aggregate since the second quarter of 2008 -- a meager annualized +0.81% growth rate over the past 35 quarters.
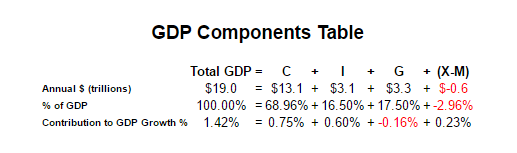
The Numbers, As Revised
As a quick reminder, the classic definition of the GDP can be summarized with the following equation:
GDP = private consumption + gross private investment + government spending + (exports - imports)
or, as it is commonly expressed in algebraic shorthand:
GDP = C + I + G + (X-M)
In the new report the values for that equation (total dollars, percentage of the total GDP, and contribution to the final percentage growth number) are as follows:
The quarter-to-quarter changes in the contributions that various components make to the overall GDP can be best understood from the table below, which breaks out the component contributions in more detail and over time. In the table below we have split the "C" component into goods and services, split the "I" component into fixed investment and inventories, separated exports from imports, added a line for the BEA's "Real Final Sales of Domestic Product" and listed the quarters in columns with the most current to the left:
Summary and Commentary
This revision boosts the headline growth about a quarter percent to +1.42% -- better but still tepid. The notable takeaways from this report are:
-- The largest upward revision was in consumer spending for healthcare and insurance.
-- The growth rate for consumer spending on goods remains anemic.
-- The inventory contraction worsened, possibly in anticipation of softer future consumer spending.
-- Foreign trade remained a bright spot and is not a drag on the headline number.
The US consumer may be spending more, but that increased spending is not on discretionary "life-style" goods. And as per usual, the Fed is once again projecting a return to "normalcy" in the form of 3% growth in future quarters -- with consumer spending leading the way. But if this past quarter's pattern persists those consumers may continue to face a toxic mix of stagnant disposable income, rising insurance costs and shrinking savings -- not exactly a formula for happy campers.
Disclosure: None


