
August 2015 Trade Data Shows Growing Trade Balance Deficit
A quick recap to the trade data released today paints a mixed picture. The unadjusted three month rolling average value of exports decelerated month-over-month - but imports accelerated. Many care about the trade balance (which decreased marginally relative to last month), and the trade balance grew.

- Import goods growth has positive implications historically to the economy - and the seasonally adjusted goods and services imports were reported up month-over-month. Econintersect analysis shows unadjusted goods (not including services) growth acceleration of 2.5% month-over-month (unadjusted data). The rate of growth 3 month trend is accelerating.
- Exports of goods were reported down, but Econintersect analysis shows unadjusted goods exports growth deceleration of (not including services) 3.9 % month-over month. The rate of growth 3 month trend is decelerating.
Inflation Adjusted But Not Seasonally Adjusted Year-over-Year 3 Month Rolling Average - Goods Export (blue line) and Goods Import Excluding Oil (red line)

z trade2.PNG
- The decrease in seasonally adjusted exports was generally across the board except for consumer and capital goods which increased. Import increase was due to consumer and capital goods.
- The market expected (from Bloomberg) a trade deficit of $-50.2 B to $-41.0 billion (consensus $-48.6 billion deficit) and the seasonally adjusted headline deficit from US Census came in at a deficit of $48.3 billion.
- It should be noted that oil imports were down 17 million barrels from last month, and up 4 million barrels from one year ago.
- The data in this series is noisy, and it is better to use the rolling averages to make sense of the data trends.
The headline data is seasonally but not inflation adjusted. Econintersect analysis is based on the unadjusted data, removes services (as little historical information exists to correlate the data to economic activity), and inflation adjusts. Further, there is some question whether this services portion of export/import data is valid in real time because of data gathering concerns. Backing out services from import and exports shows graphically as follows:
Inflation Adjusted But Not Seasonally Adjusted Year-over-Year Change Goods Export (blue line), Goods Import Excluding Oil (red line), and Goods Import with Oil (yellow line)

z trade1.PNG
Growing exports is a sign of an expanding global economy (or at least a sign of growing competitiveness).
Seasonally Adjusted Total Imports (blue line), Exports (red line) and Trade Balance (green line)
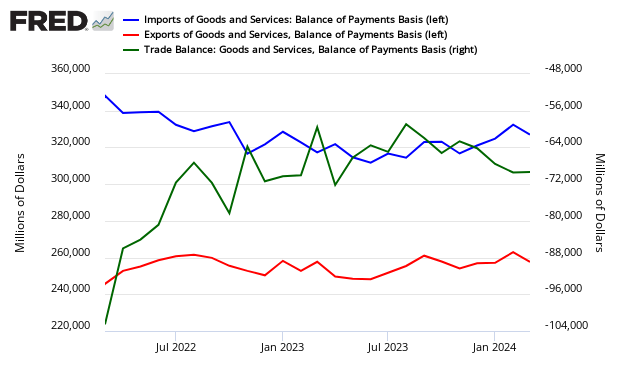
Indexing the data to the end of the recession, here is a look at the relative growth of imports and exports using current dollars as the basis for the index.
Seasonally Adjusted Total Imports (blue line) and Exports (red line) indexed to the End of Recession

Econintersect is most concerned with imports as there is a clear recession link to import contraction. Adjusting for cost inflation allows apples-to-apples comparisons in equal value dollars between periods. The graph below uses seasonally adjusted data.
Seasonally and Inflation Adjusted Year-over-Year Change Imports (blue line) and Exports (red line)

Note: In general this is a rear view look at the economy - however, imports do have a forward vision of up to three months ahead of expected economic activity.
Caveats on Using this Trade Data Index
The data is not inflation adjusted. Econintersect applies the BLS export - import price indices to the data to adjust for inflation - total exports, total imports, and imports less oil. Adjusting for cost inflation allows apples-to-apples comparisons in equal value dollars between periods.
Although Econintersect generally disagrees with the seasonal adjustment methodology of U.S. Census, in general this methodology works for this trade data series as the data is not as noisy as other series. Another positive aspect of this series is that backward revision has usually been very minor.
Econintersect determines the month-over-month change by subtracting the current month's year-over-year change from the previous month's year-over-year change. This is the best of the bad options available to determine month-over-month trends - as the preferred methodology would be to use multi-year data (but the New Normal effects and the Great Recession distort historical data).
Oil prices, and also quantities of imported oil, wobble excessively year-over-year and month-over-month. In 2010, the percent of oil imports varied between 10.4% and 14.6% of the total. In 2008 the variance was between 11.5% to over 20%. No amount of adjusting - short of removing oil imports from the analysis - allows a clear picture of imports.
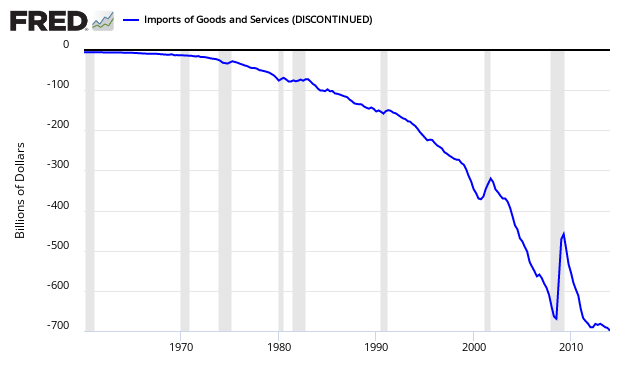
Contracting imports historically is a recession marker, as consumers and business start to hunker down. Main Street and Wall Street are not necessarily in phase and imports can reflect the direction for Main Street when Wall Street may be saying something different. During some recessions, consumers and businesses hunkered down before the Wall Street recession hit - but in the 2007 recession the Main Street contraction began 10 monthsafter the recession officially started. [Graph below is updated through 3Q2011.]

Above graph with current data:
Imports of Goods and Services
Disclosure: None.


