
As Election Euphoria Fades, Attention Averts Back To The Fed
Matters can change pretty quickly across capital markets. Just last week, much of the world was sure that Hillary Clinton would be the next President of the United States. By early evening, around 7-8 PM, the realization that this might not be the case began to set-in for markets, and what initially looked like the start of another bout of risk aversion turned into one of the strongest rallies of recent memory.
But with stocks and the U.S. Dollar both perched near resistance after enjoying a week of the ‘Trump Bump,’ the euphoria of the post-Election rally appears to be quieting and attention is now moving back on to global market’s favorite focal point: The Federal Reserve.
With a slew of Fed speakers set to offer commentary this week, we can certainly see themes shift as volatility continues. And while we’re probably not looking at a full-scale reversal in both USD and U.S. equities, we’re likely looking at some semblance of correction for one or the other. For this morning’s Market Talk, we’re looking at three large macro markets with interesting long-term setups ‘in play’ at the moment, made more interesting by last week’s price action.
The Yen
One of the biggest beneficiaries of this recent boost-higher in the Greenback has been the Japanese Yen. USD/JPY has had some of the cleanest trends over the past four years; first as Yen-weakness from 2012-2015 on the back of ‘Abe-nomics,’ and then aggressive Yen strength as Abe-nomics came undone and the Bank of Japan struggled to find their next ‘pivot’ in monetary policy stimulus.
The tough part about trading the Yen over the past four years have been the transition periods in which the trend congests before staging its next ‘big move,’ and for much of the summer USD/JPY grinded around the 100-level on the pair. And after the out-sized rip in the Greenback with the post-Election backdrop, the pair has broken up to fresh five-month highs, opening the door for the start of another trend-higher in the pair.
USD/JPY has a long-term trend-line in play, as well. On the monthly chart below, we’re looking at a trend-line that originates from the highs in 1998, connected to the highs from 2007, and projected to current price action. Notice that this old element of resistance showed up as support in June and for three months after, opening the door for bullish positions as long-term support built around the 100-level on the pair.
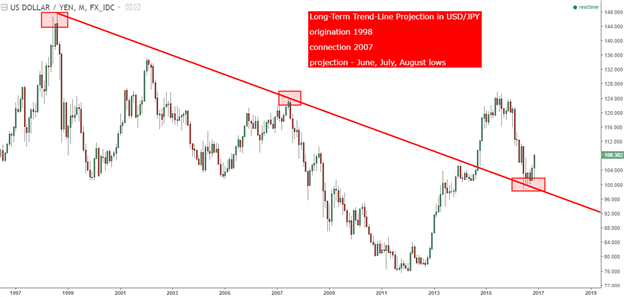
Chart prepared by James Stanley
With fresh highs now showing, traders would likely want to wait for some element of support before looking to take on bullish exposure. On the chart below, we look at three potential support levels to watch for re-entry into long positions.
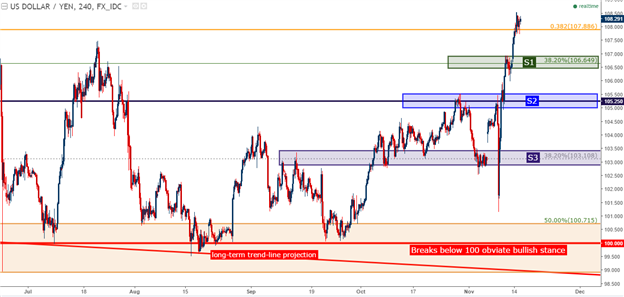
Chart prepared by James Stanley
Oil – WTI
This is another setup with long-term bearings, as a multi-year trend-line appears to still be in play after another resistance check in October. The trend-line originates in December of 1998 and can be connected to the low in November of 2001. Projecting this trend-line catches the lows of the Financial Collapse, and intersects directly with current price action over the past 22 months in WTI Oil, first as support and for the past year, resistance.
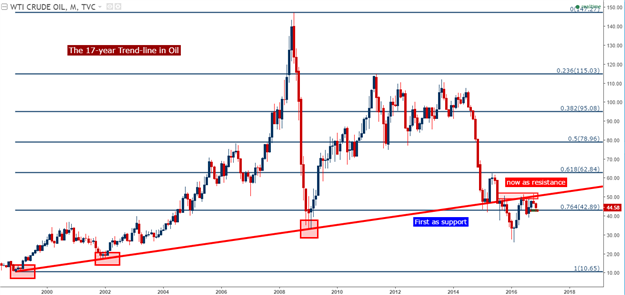
Chart prepared by James Stanley
The Fibonacci retracement seen on the chart above is relevant to today’s price action. The 76.4% Fibonacci retracement sits at $42.89, and this had functioned as the swing-low in mid-September. After a brief intersection of this level yesterday, price action has found near-term support and is moving higher, but the fact that a lower-low was able to print could open the door for down-trend continuation setups. Traders can look for short-term resistance around the prior swing of $46, shown below with an orange line.
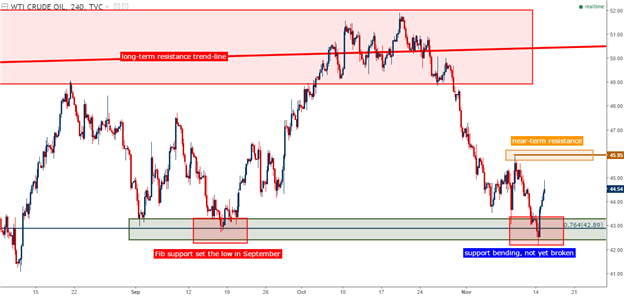
Chart prepared by James Stanley
SPX500
The S&P 500 is up 6.5% from the overnight lows on the night of the election, and currently operating in a range of resistance that’s held on the index for over four months. The S&P first shot up to the 2160-2195 area in July, a few weeks after the Brexit referendum and right after Mark Carney had warned that a slew of dovish options could be triggered by the Bank of England to proactively offset Brexit risks.
But since then, the motivation for further new highs has been lacking as the Federal Reserve has been talking up the prospect of rate cuts for much of this period. A hike in December, at least at this point, is largely priced-in with markets assigning a greater than 85% chance of a move-higher at the December Fed meeting. But more telling for future price action will likely be the Fed’s projections for next year and thereafter, and this has been a theme that’s rocked markets throughout 2016.
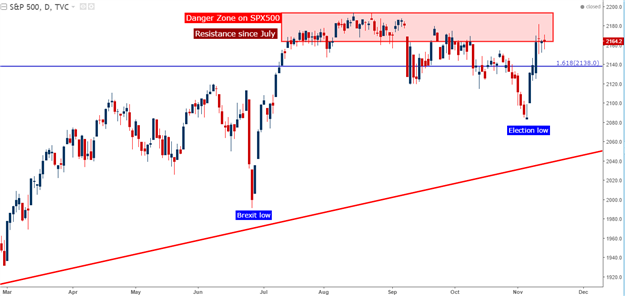
Chart prepared by James Stanley
Continue tracking these setups and more throughout the week- Subscribe to more


