
Are Low Equity Sector Correlations A Warning Sign For Stocks?
James Paulsen, chief investment strategist at Leuthold Group, sees trouble brewing in the growing disconnect between US equity sectors. He told CNBC earlier this week that correlations among US equities is unusually low and flashing a warning signal. That’s an especially dangerous sign when the stock market’s valuation is so high. Let’s dig deeper into the topic by crunching correlations on the major sector ETFs along with a broad equity market fund.
But first, the set-up. Paulsen advised:
Correlation is at one of the lowest levels in the post-War era. The combination is damaging. We now have record low correlation at the same time we have high valuations, and the combination is bad for the market. When you have this situation of the lowest quintile correlation against the highest quintile valuation since 1952, you have 10 percent declines on average.
Paulsen’s analysis carved the US equity market up into 48 buckets, using data that begins in 1952 with a 24-month rolling window. The chart below summarizes his results.
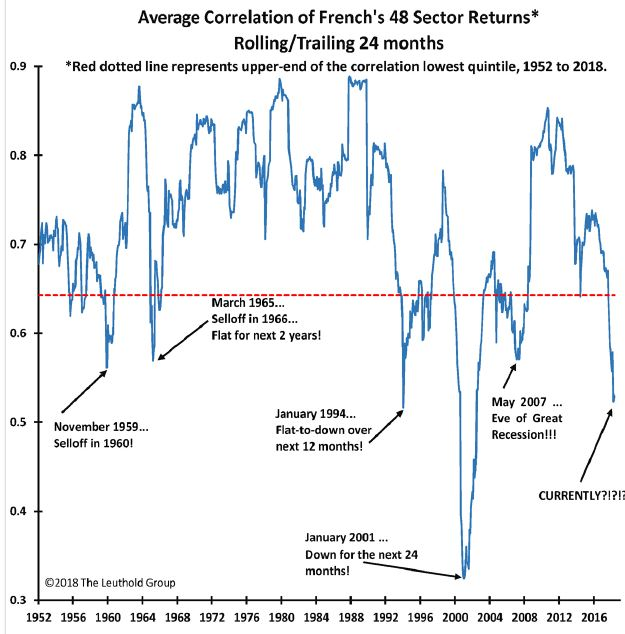
The low correlation of late, he explained, suggests that a higher percentage of shares are trailing the broad market. The low correlation reading tends to be linked with an aging bull market, Paulsen noted, adding that correlation tends to pop when selling spreads during bear markets.
Let’s see if we can replicate Paulsen’s results in R using a set of sector ETFs and a broad equity market fund. (For an illustration of using R to generate rolling correlations, see this code example here.)

Although the sector ETF histories only go back to the early 2000s, it’s clear that median correlations of the sector funds – defined as the pairwise correlations between the sector funds and vs. the broad equity market – has dropped sharply in recent history, based on a daily returns via a rolling two-year window (504 trading days, or double the standard one-year 252-trading day benchmark) through yesterday’s close (August 9).

Perhaps a more useful bit of data analytics is to break out all the current pairwise correlations for the trailing two-year correlations. Note that in the table below the correlations vary, by more than trivial amounts. For example, the correlation between utilities (XLU) and financials (XLF) is mildly negative over the past two years (-0.09). By contrast, there’s a high correlation between technology stocks (XLK) and the broad market (SPY) at 0.89. (For perspective, a 1.0 reading indicates a perfect positive correlation, zero is no correlation, and -1.0 is perfect negative correlation.)

What can you do with this information? The associated advice varies, depending on the analyst. I’ve found correlations to be valuable as part of a larger mix of risk metrics for monitoring portfolios and looking for rebalancing opportunities.
On that note, one takeaway from the numbers above is worth considering: the diversification benefits via tech have faded sharply in recent history relative to the broad equity market. The fact that XLK and SPY are closely connected (a la the 0.89 correlation) suggests that there’s considerably less value to carving out a tech-heavy allocation these days vs. holding a broadly defined equity market fund such as SPY.
Keep in mind, however, that correlation profiles will vary, sometimes dramatically, depending on the trailing window under scrutiny. In other words, to the extent that you incorporate correlations into your risk-management process you’ll need to spend time thinking through definitions and applications that relate to your investment strategy, time horizon, etc.
As for the trailing 2-year correlations presented, it’s reasonable to wonder if the data is sending a cautionary message. Paulsen certainly makes that case, although he admits that there are no guarantees.
As the CNBC story advises, Paulsen “said that, alone, low correlations and high valuations do not necessarily spell trouble, but the combination has been a negative warning for the market. While the bull market could even continue for a few more years, the correlation and valuation extremes suggest a period of turbulence.”
Disclosure: None.


