
April 29, 2015 - BEA Reports Weak 1st Quarter 2015 GDP Growth At 0.25%
In their first estimate of the US GDP for the first quarter of 2015, the Bureau of Economic Analysis (BEA) reported that the economy was growing at a +0.25% annualized rate, down sharply (-1.97%) from the +2.22% growth rate recorded for the prior quarter. And according to the "real final sales of domestic product" (BEA's very own "bottom line" for the economy), the economy actually shrank during the quarter, contracting at about a half percent (-0.49%) annualized rate, down -2.81% from last quarter's +2.32%. The difference between the headline number and "final sales" is inventory growth, which is excluded from the "bottom line" figure.
Nearly all of the critical lines items in the report were worse than during the previous quarter. Consumer spending for goods grew at a minuscule +0.05% annualized rate (down over a percent from the +1.07% growth during the fourth quarter of 2014), while consumer spending for services also showed weaker growth at +1.26% (with most of that growth in non-discretionary healthcare, housing and utilities), down some -0.65% from the +1.91% reported for 4Q-2014. Fixed investment was in outright contraction (-0.40%, down over a percent from the +0.72% growth recorded for the fourth quarter). And the worst performance was delivered by exports, which shrank at a -0.96% annualized rate -- down -1.55% from the prior quarter's rate, and clearly hammered by a strong dollar.
Inventory growth was the bright spot in this report (per the BEA's logic that ballooning inventories are mathematically good for the GDP and therefore good for the economy), contributing +0.74% to the headline number. The flip side of the strong dollar also helped imports to subtract less from the headline number (-0.29%, compared with -1.62% in 4Q-2014). And government spending contracted at a slower -0.15% annualized rate, thereby boosting the headline number by +0.20%.
Real annualized per capita disposable income increased by a significant $506 (now reported to be $38,235 per annum). This is the largest quarter to quarter growth since the fourth quarter of 2012, and it is the first time that real annualized per capita disposable income has reported cumulative net growth over the nine quarters since then. The household savings rate soared +0.9% to 5.5% (once again, the highest rate since the fourth quarter of 2012), which accounts to a large extent for the reported sluggish consumer spending.
During the first quarter of 2015 (i.e., from January through March) the seasonally adjusted CPI-U index published by the Bureau of Labor Statistics (BLS) was dis-inflationary at a -0.92% (annualized) rate. For this report the BEA assumed a very mildly dis-inflationary annualized deflator of -0.11%. Under reported dis-inflation will result in a more pessimistic headline, and if the BEA's "nominal" numbers were corrected for inflation using the line-item appropriate BLS CPI-U and PPI indexes, the economy would be reported to be growing at a much higher 3.10% annualized rate. Interestingly, during the same quarter the far more responsive Billion Prices Project (BPP) recorded mild positive inflation. If the BPP inflation metric was used to deflate the nominal BEA data the economy could be shown to be contracting at a more than -1.50% annualized rate.
Among the notable items in the report :
-- The headline contribution from consumer expenditures for goods was +0.05% (down -1.02% from the prior quarter).
-- The contribution made by consumer services spending to the headline decreased to +1.26% (down -0.65% from the previous quarter). Healthcare spending provided about half of services growth. The combined consumer contribution to the headline number was 1.31%, down -1.67% from the prior quarter.
-- Contracting commercial private fixed investments removed -0.40% from the headline number -- down over a full percent (-1.12%) from the fourth quarter of 2014. This drop occurred in spending for structures, industrial equipment and IT equipment. Some growth was reported in transportation equipment and intellectual property.
-- Inventory growth added +0.74% to the headline number (up +0.84% from the previous quarter). Once again it is important to note that this number has logically and historically been nearly zero-sum over extended time periods, and future mean reversion to the zero sum should be expected.
-- Governmental spending removed -0.15% from the headline (up +0.20% from the -0.35% for the previous quarter). The contraction was largely the result of decreased state and local spending on infrastructure.
-- Exports are now reported to be subtracting -0.96% from the headline growth rate (down -1.55% from the previous quarter).
-- Imports subtracted substantially less from the headline number (-0.29%) than during the prior quarter (-1.62%) -- also an expected consequence of the stronger dollar.
-- The "real final sales of domestic product" is now contracting at a -0.49% annualized rate. This is the BEA's "bottom line" measurement of the economy and it excludes the reported inventory growth.
-- And as mentioned above, real per-capita annual disposable income grew substantially during the quarter (up $506 per year quarter-to-quarter). The new number represents an annualized growth rate of +5.47%. But it is up only +4.25% in aggregate since the second quarter of 2008 -- an annualized +0.62% growth over the past 26 quarters. The reported softening growth in consumer spending is a consequence of a significant increase in household savings -- i.e., most of that $506 went into savings.
The Numbers
As a quick reminder, the classic definition of the GDP can be summarized with the following equation :
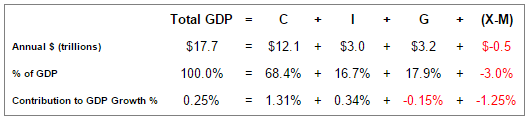
GDP = private consumption + gross private investment + government spending + (exports - imports)
or, as it is commonly expressed in algebraic shorthand :
GDP = C + I + G + (X-M)
In the new report the values for that equation (total dollars, percentage of the total GDP, and contribution to the final percentage growth number) are as follows :
GDP Components Table
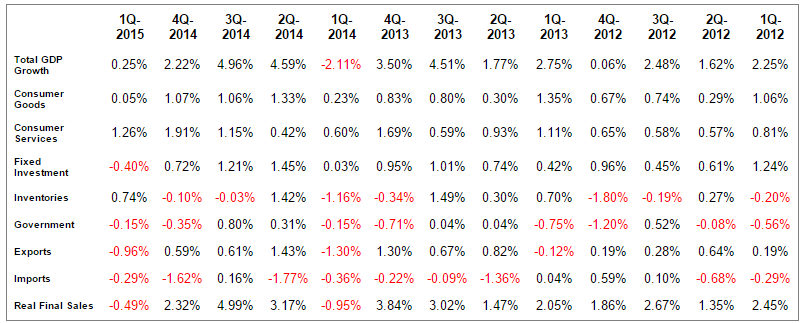
The quarter-to-quarter changes in the contributions that various components make to the overall GDP can be best understood from the table below, which breaks out the component contributions in more detail and over time. In the table below we have split the "C" component into goods and services, split the "I" component into fixed investment and inventories, separated exports from imports, added a line for the BEA's "Real Final Sales of Domestic Product" and listed the quarters in columns with the most current to the left :
Quarterly Changes in % Contributions to GDP
Summary and Commentary
These numbers show materially weaker economic growth within the US. The headline number is positive only because of ballooning inventories, and not because of strong commercial investments or organic growth in consumer spending for discretionary goods or services. Exports were hammered, and the continued strength of the dollar does not bode well for exports moving forward.
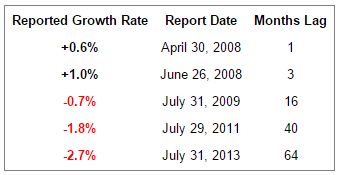
What's worse is that the BEA is famously incapable of accurately monitoring a weakening economy in "real time." They may eventually get it right, but only several years after the fact. For example, consider the BEA's constantly changing numbers for the first quarter of 2008 -- from the +0.6% growth shown in an April 30th "real time" report (which, incidentally, grew to +1.0% over the next two months) to a disastrous -2.7% contraction after due consideration and massive revisions (some 64 months later) :
BEA's Changing View of First Quarter 2008 GDP
We are not suggesting that the first quarter of 2015 is as bad as the first quarter of 2008. We are suggesting that we may not know exactly how bad it was for some time to come.


