
Apple, FANGS And Monetary Fools
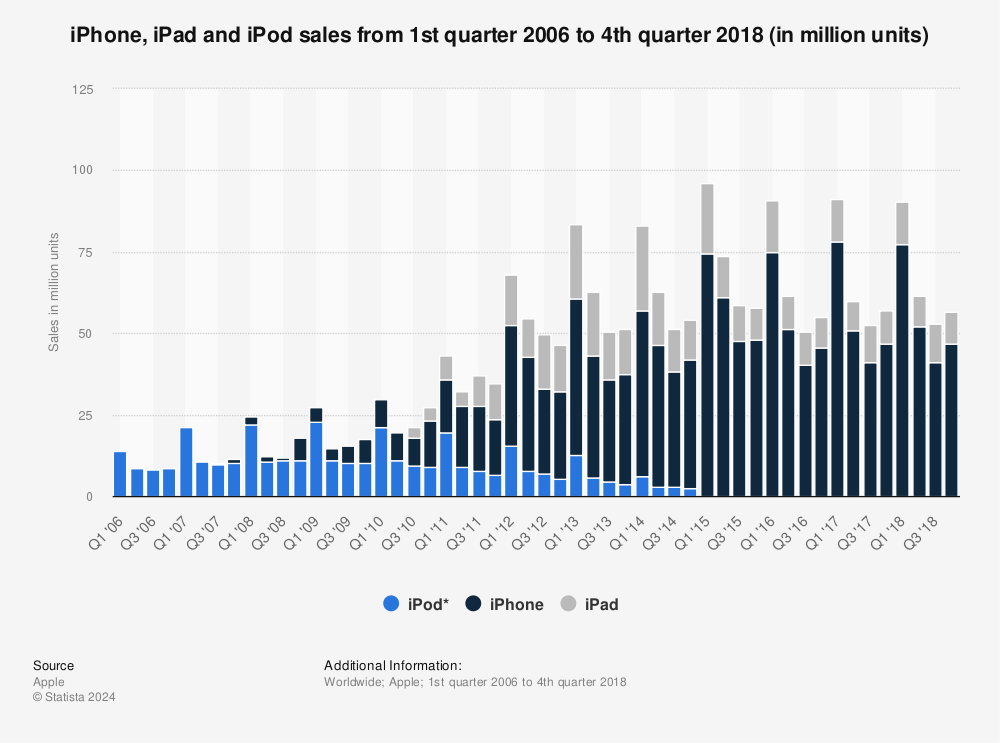
This week the great tree of Apple (AAPL) finally stopped growing toward the sky. During its latest quarter, in fact, i-Pad sales were down 25%, Mac volume came in 4% lower and even the i-Phone barely breached the flat line.
In all, Apple’s mighty machine of double digit growth posted a revenue gain of just 1.7% over prior year, while its net income was essentially flat. The real news, however, was that management is now projecting an actual 11% y/y decline in sales during the current quarter.
Don’t get me wrong. Apple has been the most awesome fount of product invention, global production and supply chain proficiency, logistics and marketing innovation and consumer brand value creation in modern history—perhaps ever.
Its products—especially the smart phone—did fundamentally transform the daily life of the world. Apple’s installed base of one billion devices is a living testimonial to its fanatical focus on bringing to the consumer a truly transformative digital age experience.
Yet it all happened in well less than 10 years. Indeed, while the tech world was booming in the 1990s, APPL was struggling. Between 1990 and 2004, revenue grew at only 4% per annum and earnings did not increase by one thin dime.
That’s right. Apple’s net income stalled out at $500 million per year for a decade and one half—or at a level equal to two days profits during the quarter just reported.
That wasn’t much to write home about under any circumstance, but was especially wimpy compared to Microsoft (MSFT), where sales and net income grew at a 27% CAGR during that period; or Cisco, where sales and earnings soared by 50% annually for 15 years running.
And that brings us to the lunatic valuation of the FANGS, which was also on display again this week, and why 100X+ PE multiples are always and everywhere a deformed artifact of central bank driven Bubble Finance, not the emission of an honest capital market.
The fact is, the greatest technology-based businesses of modern times accomplished its dramatic growth spurt in just over 20 quarters between 2011 and 2015. That was after the i-Phone incepted and the i-Pad worked up a serious head of steam.
Now Apple is pan caking or worse, and it is hard to believe that gimmick products like Apple Watch or Oculus can fill the hole from the fast fading i-Pad and the stalling i-Phone. No harm done, of course, and its entirely possible the APPL will have another modest growth run.
But here’s the thing. Apple essentially proves you can’t capitalize anything at 100X except in extremely rare cases because of the terminal growth rate barrier. That is, after a few years of red hot growth almost every large company’s organic growth rate bends toward the single digit path of GDP.
In this respect, Microsoft and Cisco (CSCO)surely prove the rule. After their blistering 1990’s growth, the were valued at 75X and 230X reported earnings, respectively, at the tech bubble peak in 2000. But the terminal year growth rates implied in those towering multiples were not to be——even for two of the most inventive companies of the digital age.
During the last fifteen years, Microsoft’s net income has grown at a 5.9%annual rate and Cisco’s at 7.8%. Technology shifts, competition and global macroeconomic trends together conspired to bend their red hot growth trajectories toward the flat line.
As a consequence, they have spent the entirety of this century shedding market cap and enduring PE multiple compression.

MSFT Market Cap data by YCharts
As can be seen above, between December 1999 and the end of 2014, Microsoft’s market cap declined from $600 billion to $380 billion, meaning it shed $220 billion of valuation, as its PE contracted from 75X to 18X (its market cap currently is slightly higher at $420 billion).
Likewise, Cisco’s market cap plunged from $530 billion to $140 billion. Thus, despite 15 years of respectable growth it was forced to shed $410 billion of market cap, while its PE multiple ended up resembling Ross Perot’s famous sucking sound to the south, plunging from 230X at the tech bubble peak to 19X at the end of 2014.
Since these two companies are among the best long term performers and profit generators of all time, they speak powerfully to the terminal year growth barrier. In effect, when “investors” capitalize a growth company’s hot years at a triple digit PE they are drastically overvaluing its terminal year potential. And virtually without exception, they spend the post growth streak years in PE compression and market cap shrinkage.
At best, these high flyers turn out to be 10-20% long term growers, or at worst shooting stars like Lucent (LUTHP) or Dell where 80-100% of the peak market cap gets wiped out by the passage of time and events.
Consider the 25-year growth rate of five important and surviving growth icons of modern times. Apples’ quarter-century net income CAGR ending in the year just reported is 20%. That for Cisco is 18%, Microsoft 17.5%, Intel (INTC) 15% and Berkshire Hathaway (BRK-A) 15%.
Yet today every one of these companies trade at market caps well below their boom year peaks—even after giving consideration to the balance sheet deterioration resulting from debt-financed stock buybacks. Specifically, relative to its peak market cap, Cisco is current down by 80%, Intel by 68%, Microsoft by 32%, Apple by 26% and Berkshire Hathaway by15%.
So there’s the skunk in the woodpile. What is going on under the heading of “growth” company valuation is just pure speculation in the casino. There is absolutely nothing rational or economically efficient about the 100X PEs. The latter get attached to the casino’s trading sardines of the month or year which get temporarily designated as “growth”stars.
History virtually proves that you can’t go wrong selling the high flyers if you have the patience and capital depth to wait out the serial bubble cycles of the world’s out-of-control central banks. In that respect, this week brought another raft of just that kind of opportunity.
Yes, Amazon (AMZN) disappointed the absurdly precise and ultra aggressive “growth” targets of Wall Street analysts and traders. But so what?
Its PE ratio was marked down from 900X to 475X, meaning it’s still a screaming sale. Back up the trucks!
After all, when you spend 25 years creating a monstrous machine that is resolutely and maniacally focused on spending every dime of revenue on global empire building, it will never generate a measurable profit or return on capital. Well, at least not more than the anemic 3.3% pre-tax return it posted for 2015.
Thus, it is only a matter of time before unforeseen external events, such as an ordinary business cycle downturn, to say nothing of the impending global deflation, trigger a drastic re-rating and PE compression. Then the fast money and robo machines will dump the stock hand over fist as usual—and long before the inattentive home gamers wake up to find themselves the victim of another epic slaughter.
Likewise, Facebook (FB) purportedly “surprised” to the upside, and is now trading at close to 90X. But here’s the thing. If you wish to believe that FB really has 1.6 billion carbon unit-based monthly users, you might also want to check into some Florida swampland.
Otherwise recognize that the social media sphere is crawling with silicon-based fake users and mercenary bots, and that their contamination of Facebook’s preposterous user stats is undoubtedly beyond reckoning. Yes, FB occasionally purges the worst incursions, but surely Justin Beiber’s 3.5 million fake fans was only a drop in the bucket.
Besides that, it doesn’t really matter what the mix of carbon vs. silicon based units is in FBs massive user stats. At the end of the day, Facebook is essentially a digital billboard. It’s a place where mostly millennials idle their time in or out of their parents’ basement. Whether they grow tired of Facebook or not remains to be seen, but one thing is certain.
Namely, advertising is slaved to GDP growth and always takes a hit when the business cycle turns south. Indeed, the pool of advertising dollars is relatively fixed at about $175 billion in the U.S. and $575 billion worldwide and grows in the low single digit zip code after you take account of the severe cyclical fluctuations which always slam the ad spend. For instance, during the Great Recession, the U.S. advertising spend declined by 15% and the worldwide spend dropped by 11%.
And therein lies another skunk in the woodpile. Due to its sharp cyclicality, the ad spend is a distinctly low-growth pool of money. And that pool of money is fiercely competed for by the various media venues. Thus, the U.S. ad spend of $177 billion in 2015 was only $5 billion greater than the $172 billion spend way back in 2008.
So when you average out the cyclical fluctuations, the trend growth in U.S. ad spending has been about 0.5% per annum. Likewise, the global ad spend increased from about $490 billion in 2008 to $575 billion in 2015, reflecting a growth rate of 2.3% annually.
Yes, there has been a rapid migration of dollars from TV, newspapers and other traditional media to the digital space in recent years. But the big shift there is already over.
The digital share of the U.S. ad pool, in fact, rose from 13.5% in 2008 to an estimated 32.5% last year. But even industry optimists do not expect the digital share to gain more than a point or so per year going forward. After all, television, newspapers, magazines and radio and highway billboards are not going to disappear entirely.
Moreover, roughly half of the digital share comes in the form of search advertising. FB does not even participate in that sector, where Google has upward of a 55% market share.
Consequently, there are not remotely enough advertising dollars in the world to permit the endless gaggle of social media space entrants to earn revenue and profits commensurate with their towering valuations and the sell side’s hockey stick growth projections.
So once again we have the delusion that the 52% revenue growth that FB booked in its most recent quarter can be continued indefinitely, when it will, in fact, by pulled-down to the GDP growth line in only a matter of time.
Accordingly, now would be an excellent time to sell the stock, and back up the trucks. You can’t capitalize a one-time share shift in the quasi-static ad spending pie as if it represents a permanent rate of growth. Indeed, most especially not in a world heading into an extended period of deflation and static or even shrinking nominal GDP.
And do believe that this third and greatest central bank driven bubble of this century is well past its sell-by date. The central bankers are getting downright deranged, as Kuroda-san demonstrated on Friday.
Japan is an old age colony sinking into the Pacific. The very last thing it needs is more inflation to erode the purchasing power of its massive and growing retired population, and then to tax their bank accounts with a negative interest rate to boot.
After what amounts to 20 years of ZIRP and QE, the grand Keynesian monetary experiment of the present era has been proven an utter failure in Japan, which is now sliding into its 5th recession in seven years.
Why do they keep resorting to madcap expansion of central bank balance sheets, and thereby the systematic falsification of financial asset prices? Ostensibly, the aim is to reverse a deadly run of consumer price deflation.
But here’s Japan’s CPI over the last 35 years. That is not deflation!

In fact, the 2% mantra has no basis in economic logic or proof in financial history. It’s just a giant cover story that the world’s fraternity of central bankers have invented to justify there massive and constant monetary intrusion.
But here is the real reason why Japan went to NIRP. The Nikkei was down 24% from its June peak. The desperate fools who run the BOJ panicked and voted 5-4 to stop the hissy-fit. That’s all there was to it.

The BOJ’s NIRP gambit may provide a few days of relief at best, but then the implosion of the world’s monumental financial bubble will continue, and even gather pace.
Why? Because the central banks have shot their wad. Two decades of madcap credit expansion have brought Japan and most of the rest of the world to a condition of peak debt, which means that the central banks are now simply pushing on a credit string.
For the better part of seven years that foolish endeavor has generated massive unsustainable inflation of financial asset values.It has fueled the lunacy of 100X growth company bubbles.
But as the global economy sinks into the deflationary recession that is inherent in a crack-up boom, it will become increasingly evident that they are powerless to alter the course of the real economy.
Eventually the prospect of recession that can’t be cured by the central bank printing presses will ignite sheer panic in the casino. Then the monetary fools running them will be reviled to the ends of the earth. But not before the lunatic 100X valuations of the FANGs implode like those of all the high flyers which have gone before.
For the third time this century it is time to sell the bubble. Yes, do back up the trucks!
Disclosure: None.


