
And Then We Bounced ...
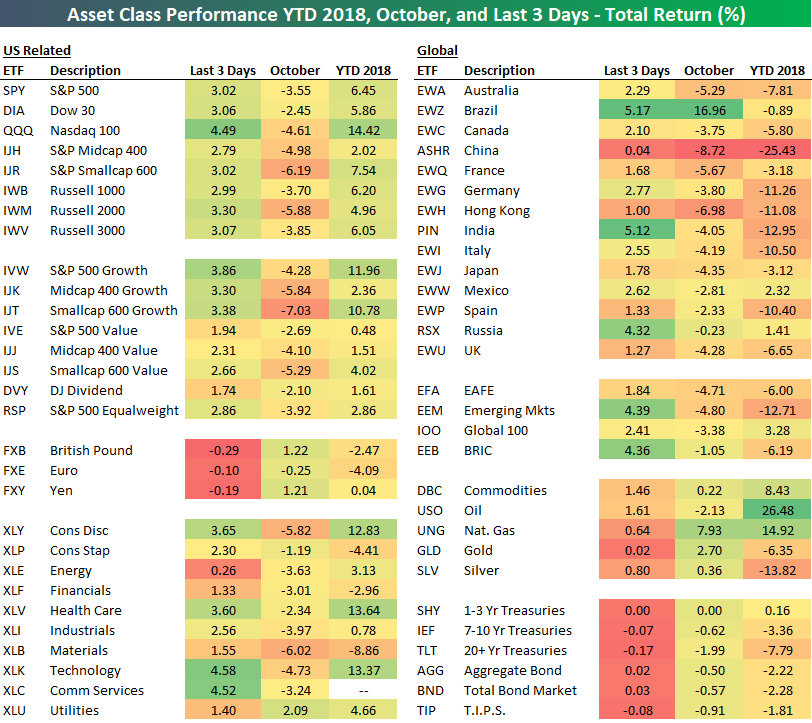
After a huge drop to start October, the S&P 500 (SPY) has rebounded 3% over the last 3 trading days going back to Thursday’s close. Below is a look at the performance of various asset classes during this 3-day bounce along with October and year-to-date performance as well.
The Nasdaq 100 (QQQ) took it on the chin the most during the early October sell-off, and now it’s up the most out of the major US index ETFs during the bounce back. Growth has crushed value on the bounce back as well, but growth is still lagging value badly for the month (but not for the year).
Technology (XLK) and Communication Services (XLC) are up the most over the last 3 days, while Energy (XLE) is up the least at just 0.26%.
Outside of the US, Brazil (EWZ) is up more than any other country over the last 3 days with a gain of 5.17%, leaving it up a whopping 16.96% month-to-date. That’s easily the best performing ETF in the entire matrix. On the flip side, China (ASHR) can’t catch a break as it’s flat over the last 3 days while everything else has rallied, and it’s down 25.43% YTD.
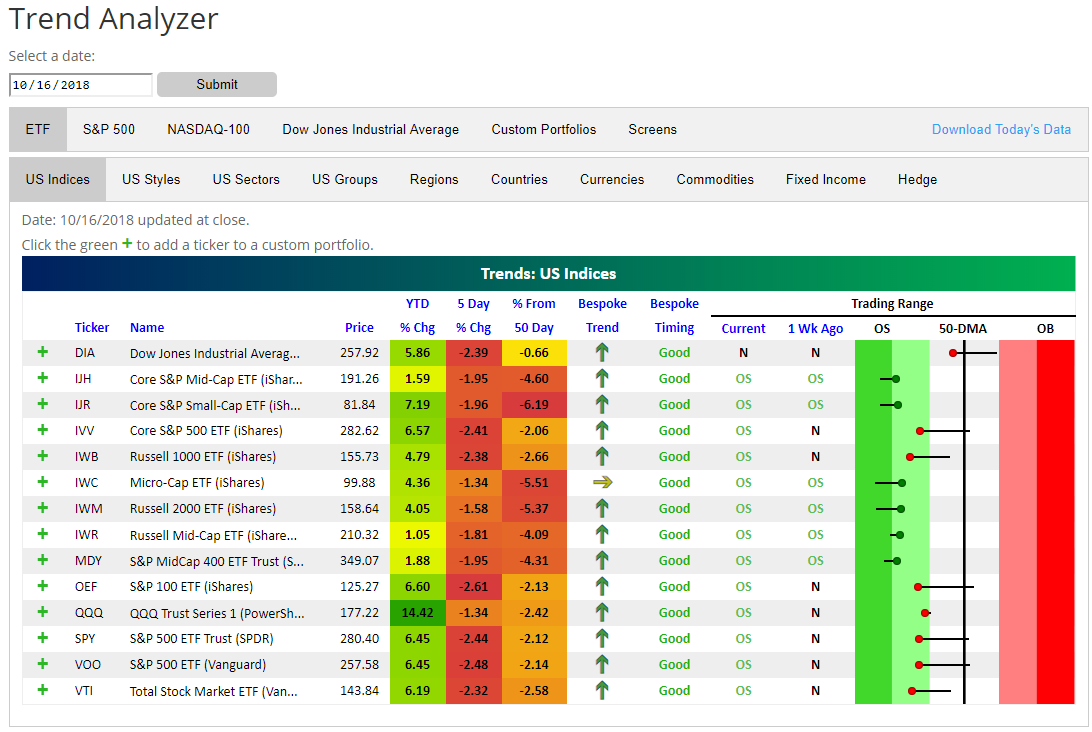
(Click on image to enlarge)
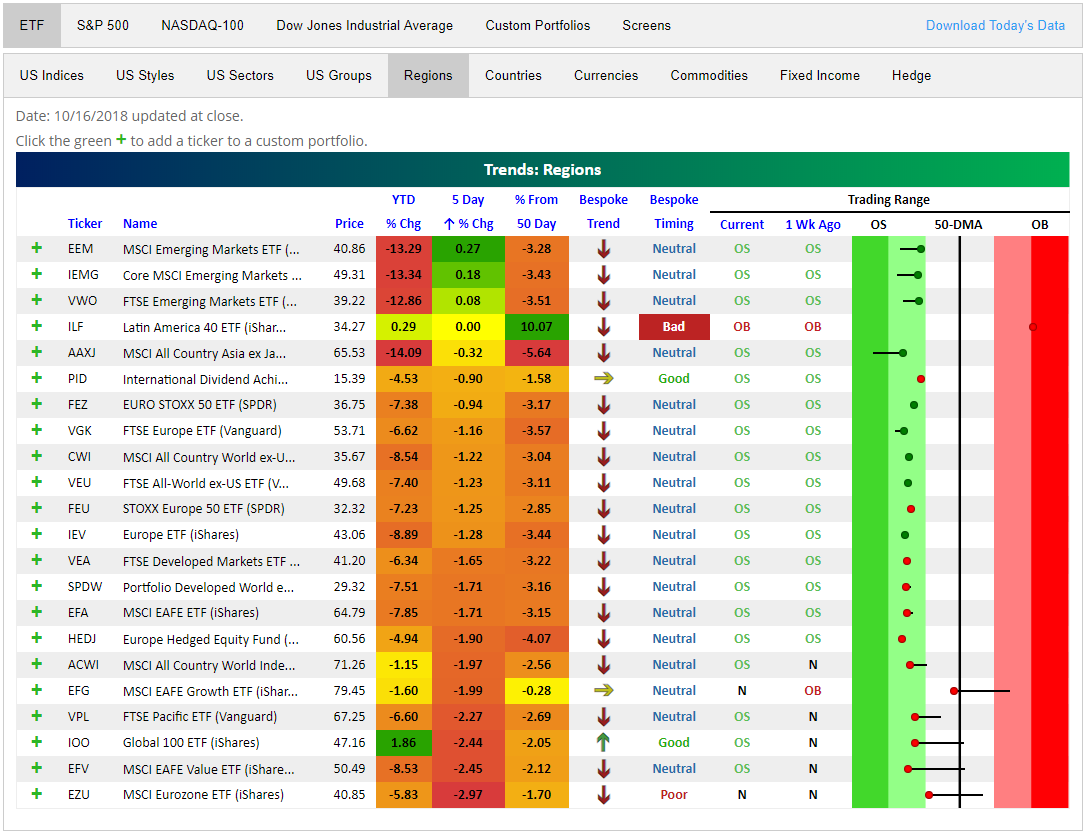
(Click on image to enlarge)
Disclaimer: To begin receiving both our technical and fundamental analysis of the natural gas market on a daily basis, and view our various models breaking down weather by natural gas demand ...
more

