
Analyzing The Bull Market Thesis - Saturday, July 21

- Review & Update
- Analyzing The Bull Market Thesis
- Sector & Market Analysis
- 401k Plan Manager
Stocks Rise Following Breakout
In last week’s missive “Bulls Run On Yellen’s Easy Money,” I addressed the breakout and why we increased equity exposure modestly in portfolios.
“However, this changed this past week as Yellen uttered the two magic words: ‘EASY MONEY.’
Okay, it wasn’t exactly two words. It was actually:
‘Because the neutral rate is currently quite low by historical standards, the federal funds rate would not have to rise all that much further to get to a neutral policy stance.’
In other words, by saying that interest rates would not have to rise much further, the markets translated that to ‘lower interest rates for longer,’ confirming the Federal Reserve will remain “highly accommodative” to the markets so, therefore, ‘buy stocks.’
And with that, the robots leaped into action pushing markets OUT of the month-and-a-half long trading range of just 1.5%. This push to new highs, as noted above, also triggered a short-term ‘buy signal,’ at the bottom of the chart, which suggests this rally should continue higher over the next week, or so, heading into the month of August.”
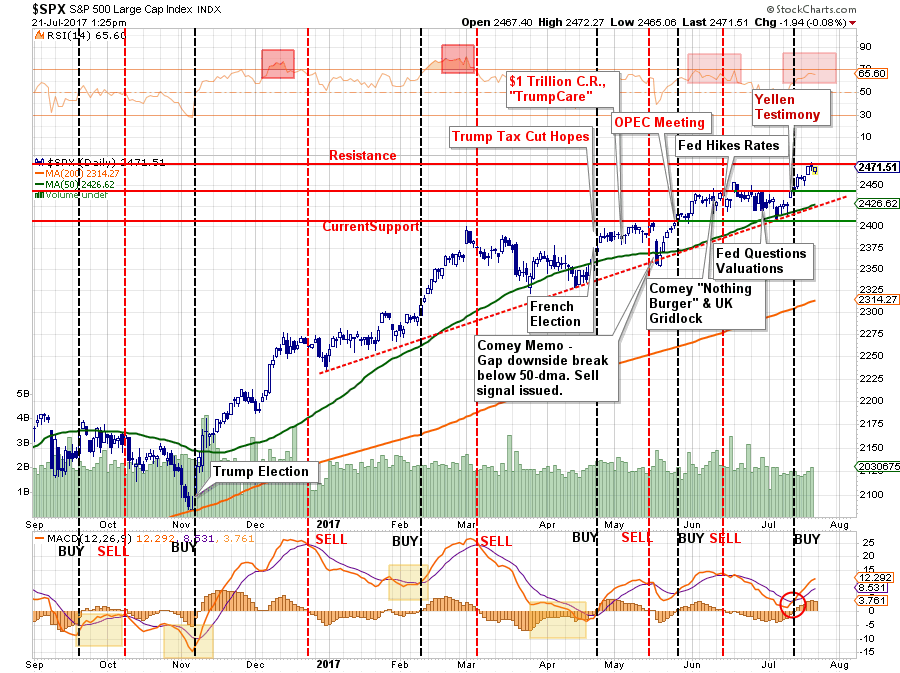
“With the break above 2452 on Friday, assuming it will hold above that level into next week, it will provide an opportunity to increase short-term equity allocations in portfolios. However, be mindful, this is VERY short-termin nature and could be quickly reversed – so manage your risk accordingly.”
As stated, this analysis is VERY short-term in nature. Price trends are currently positive which keeps portfolios long-biased for the time being. However, while our portfolios are “bullishly” positioned for the short-term, we remain much more pessimistic about the longer-term return dynamics.
I want to spend the rest of this weekend’s missive analyzing the ongoing bull thesis that has been pushed out by the media recently.
Analyzing The Bull Thesis
“Exactly a decade ago, it was time for investors to start worrying, even as stocks sat at record highs and the signs of onrushing danger were far from obvious.”
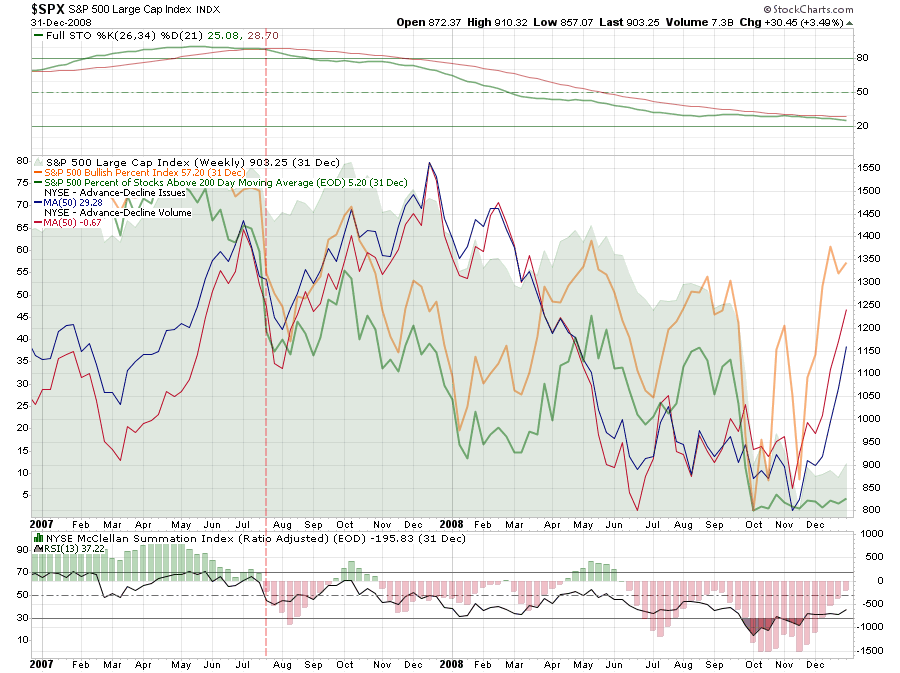
I am not so sure that warning signs weren’t obvious. Starting in mid-2007, the market began to struggle to make gains and initial “sell signals” were given as internal measures began to deteriorate.
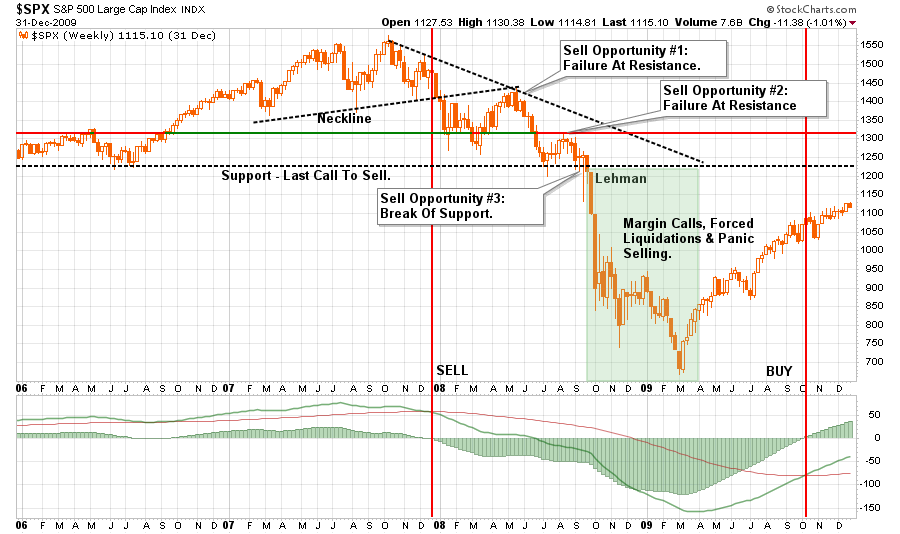
Furthermore, as shown in the chart below, the “financial crisis” was not a sudden event. Had investors been paying attention to the market, rather than listening to the advice of “buying the dips” or Fed Chairmen declaring “subprime is contained” and “it’s a Goldilocks economy,” there were three separate opportunities to step aside BEFORE the Lehman event ever occurred.
Yet, in 2007, much like today, individuals were being told to disregard much of the same evidence that existed then as they are today. Let’s take a look at a few of the arguments being made currently.
Earnings Growth Is Driving The Markets
The bulls currently have the “wind at their backs” as the continued “hope” the Trump administration will foster an age of deregulation, infrastructure spending and tax cuts which will boost corporate earnings in the future. Shortly after the election in 2016, Jack Bouroudjian via CNBC wrote:
“Let’s be clear, this market run up to the 20K level has a much more solid foundation for valuation. We are not looking at a P/E which has been stretched beyond historical norms as was the case in 1999, nor are we looking at a dot com bubble ready to implode. On the contrary, between digestible valuations and the prospects of real pro-growth policies, we have the foundation for a run up in equities over the course of the next few years which could leave 20K in the dust.”
The problem is 9-months later there has been no advancement on that legislative agenda while the markets have surged more than 18% since the election. As I discussed previously, the market has already priced in the expected earnings growth from the “promised” Trump agenda which puts the market in danger of disappointment.
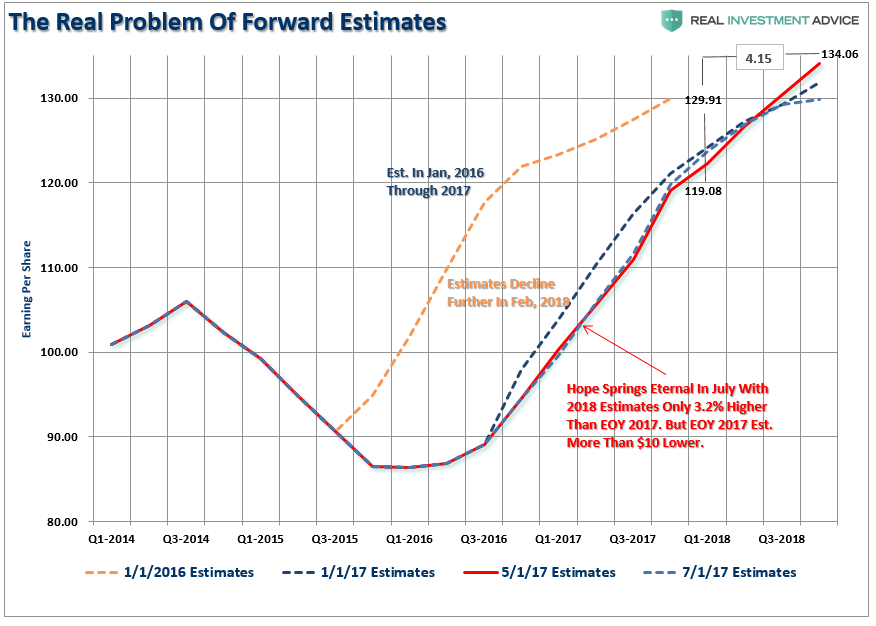
“Given that stocks have surged based on ‘hopes’ of deeper tax cuts, a tax cut only roughly half of previous estimates certainly puts valuations at risk. Once again, the market has already priced in earnings growth through 2018, making disappointment a much higher probability.”
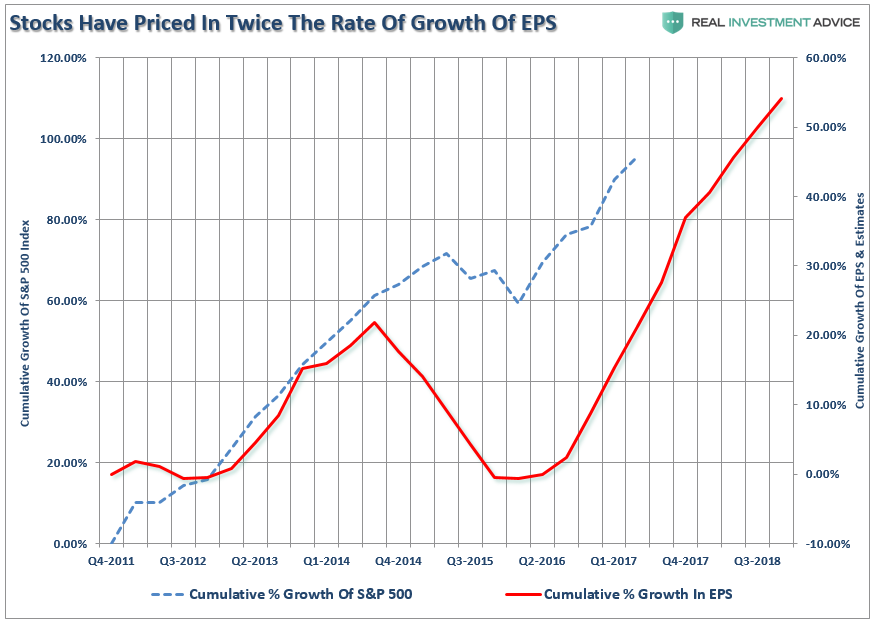
“Considering that forward estimates are generally overstated by 33% on average, the risk is high of disappointment. As shown below, there was a $10 difference between what earnings were expected to be in 2017 at the beginning of 2016 and today. Furthermore, forward earnings have only risen by $4.15/share for the end of 2018. Yet, as shown, above prices have more than priced in that future growth.“
However, as Dr. Lacy Hunt recently discussed, this may not be the case.
“Considering the current public and private debt overhang, tax reductions are not likely to be as successful as the much larger tax cuts were for Presidents Ronald Reagan and George W. Bush. Gross federal debt now stands at 105.5% of GDP, compared with 31.7% and 57.0%, respectively, when the 1981 and 2002 tax laws were implemented. Additionally, tax reductions work slowly, with only 50% of the impact registering within a year and a half after the tax changes are enacted. Thus, while the economy is waiting for increased revenues from faster growth from the tax cuts, surging federal debt is likely to continue to drive U.S. aggregate indebtedness higher, further restraining economic growth.
However, if the household and corporate tax reductions and infrastructure tax credits proposed are not financed by other budget offsets, history suggests they will be met with little or no success. The test case is Japan. In implementing tax cuts and massive infrastructure spending, Japanese government debt exploded from 68.9% of GDP in 1997 to 198.0% in the third quarter of 2016. Over that period nominal GDP in Japan has remained roughly unchanged. Additionally, when Japan began these debt experiments, the global economy was far stronger than it is currently, thus Japan was supported by external conditions to a far greater degree than the U.S. would be in present circumstances.”
With analysts once again hoping for a “hockey stick” recovery in earnings in the months ahead, it is worth noting this has always been the case. Currently, there are few, if any, Wall Street analysts expecting a recession at any point the future. Unfortunately, it is just a function of time until the recession occurs and earnings fall in tandem.
Valuations
Another argument often used to support the “bullish” meme is that valuations aren’t as high as they were in 2000. While that is true, there is a vase fundamental difference between now and then. In 2000, as valuations surged toward 42x CAPE earnings, there were MANY technology companies with negative earnings which skewed the valuation measure. Most of the companies are now gone, or the ones that survived finally begin generating earnings.
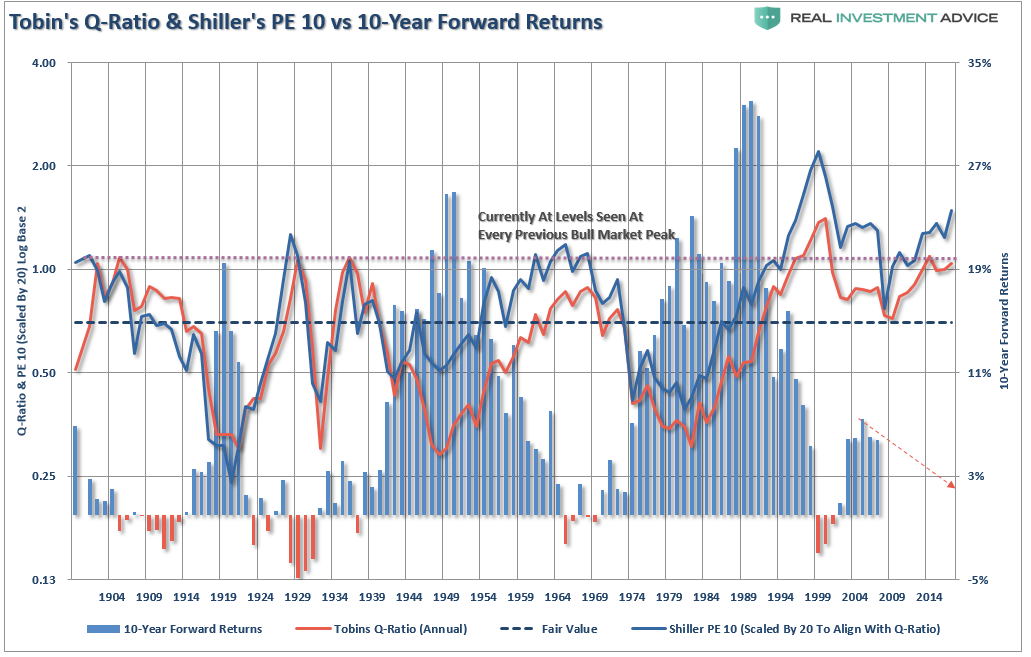
While valuations are NOT a good market timing indicator, and are not predictive of the end of a bull market advance, by all historical measures, they are expensive. Most importantly, while high valuations certainly aren’t predictive of bear market onsets, they are HIGHLY predictive of very low returns in the future.
One of the other arguments to justify higher valuations has been that interest rates are so low. Okay, let’s take the smoothed P/E ratio (CAPE-10 above) and compare it to the 10-year average of interest rates going back to 1900.
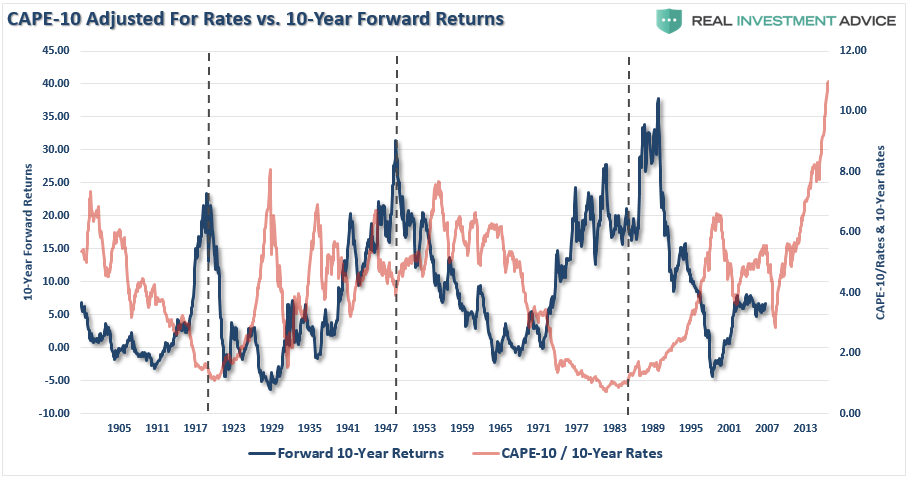
Importantly, the statement of “lower future returns” is very misunderstood. Based on current valuations the future return of the market over the next decade will be in the neighborhood of 2%. This DOES NOT mean the average return of the market each year will be 2% but rather a volatile series of returns (such as 5%, 6%, 8%, -20%, 15%, 10%, 8%,6%,-20%) which equate to an average of 2%.
Sentiment Is Bullish
Of course, as discussed previously, investor behavior makes forward long-term returns even worse.
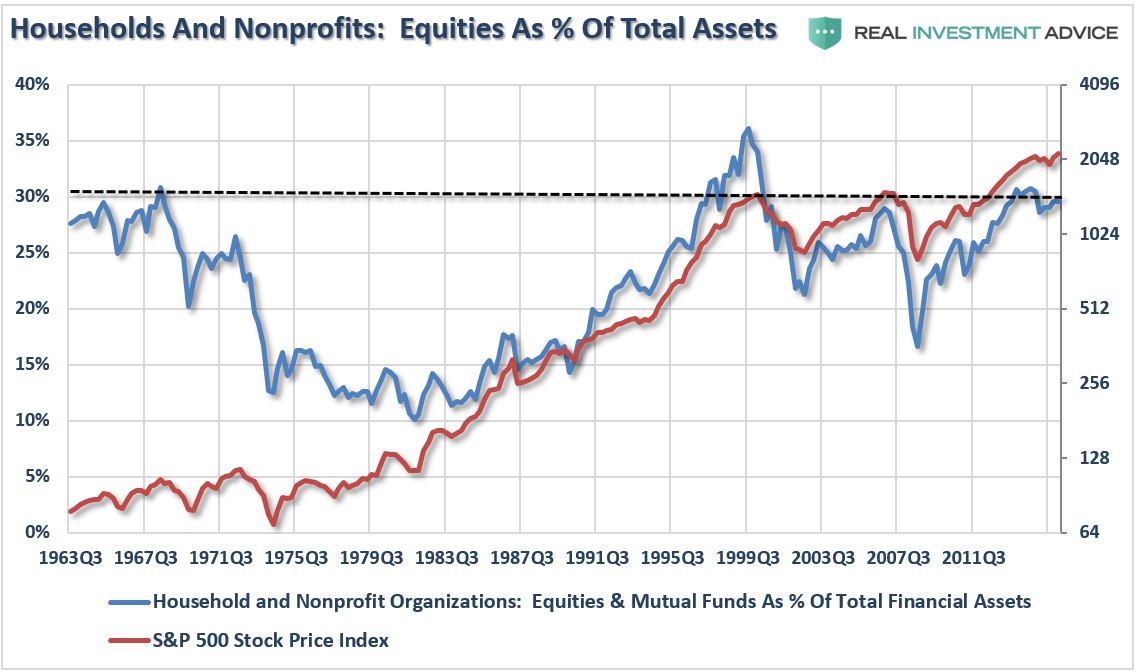
The bulls have continually argued the “retail” investor is going to jump into the markets at any moment which, with all the “cash on the sidelines,” will keep the bull market alive. The chart below suggests they are already in. At 30% of total assets, households are committed to the markets at levels only seen near peaks of markets in 1968, 2000, and 2007. I don’t really need to tell you what happened next.
Furthermore, as I have discussed repeatedly in the past, there is NO “cash on the sidelines” to begin with. To wit:
“Every transaction in the market requires both a buyer and a seller with the only differentiating factor being at what PRICE the transaction occurs. Since this must be the case for there to be equilibrium to the markets there can be no ‘sidelines.’
Furthermore, despite this very salient point, a look at the stock-to-cash ratios also suggest there is very little available buying power for investors current.”
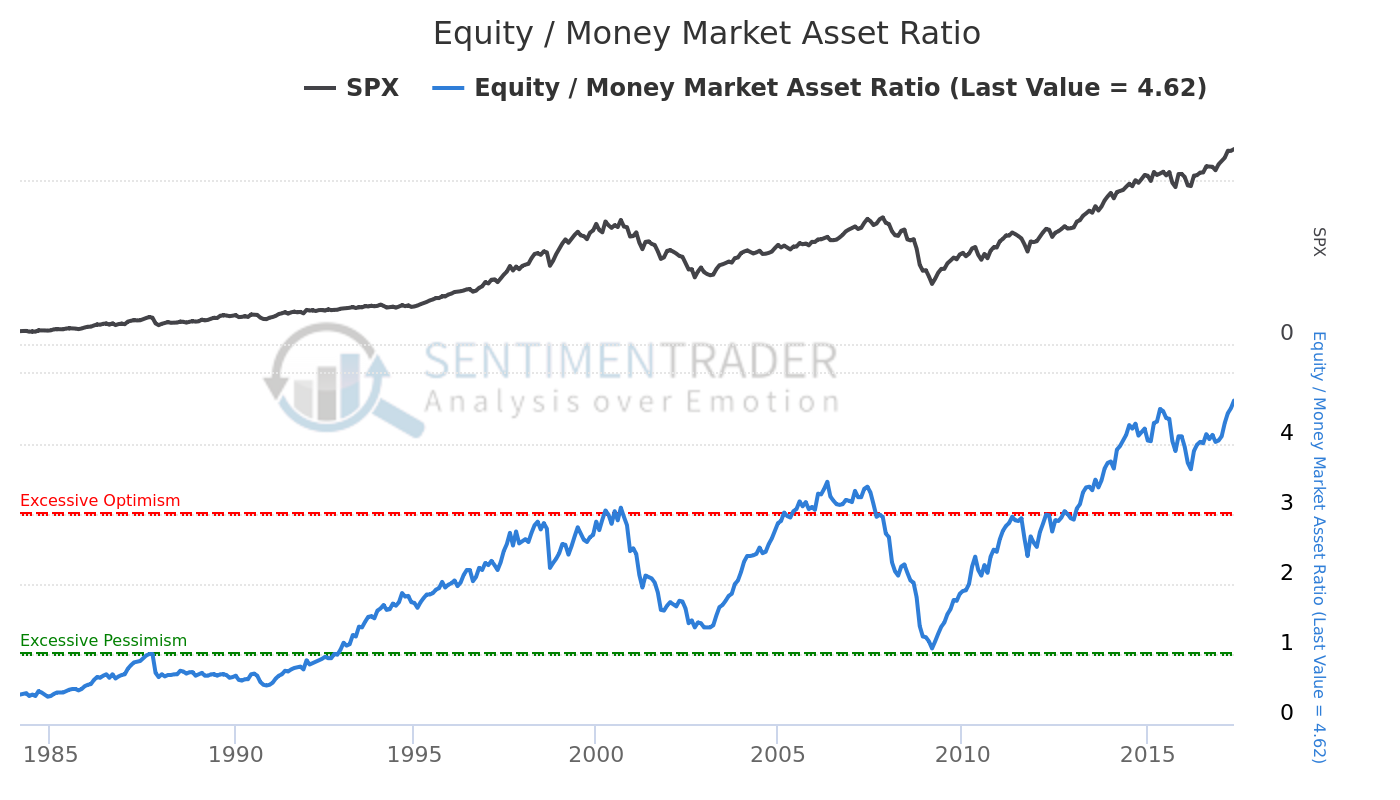
There is no cash on the sidelines.
Furthermore, the dearth of “bears” is a significant problem. With virtually everyone on the “buy” side of the market, there will be few people to eventually “sell to.” The hidden danger is with much of the daily trading volume run by computerized trading, a surge in selling could exacerbate price declines as computers “run wild” looking for vacant buyers.
This thought dovetails into the “hyperextension” of the market currently. Since price is a reflection of investor sentiment, it is not surprising the recent surge in confidence is reflected by a symbiotic surge in asset prices.
The chart below shows the deviation above the 3-year moving average. Importantly, at the peak of the previous two bull markets, the deviation never pushed into the 3-standard deviation range as it is currently. This suggests there is VERY little room left to the upside before some corrective action occurs.
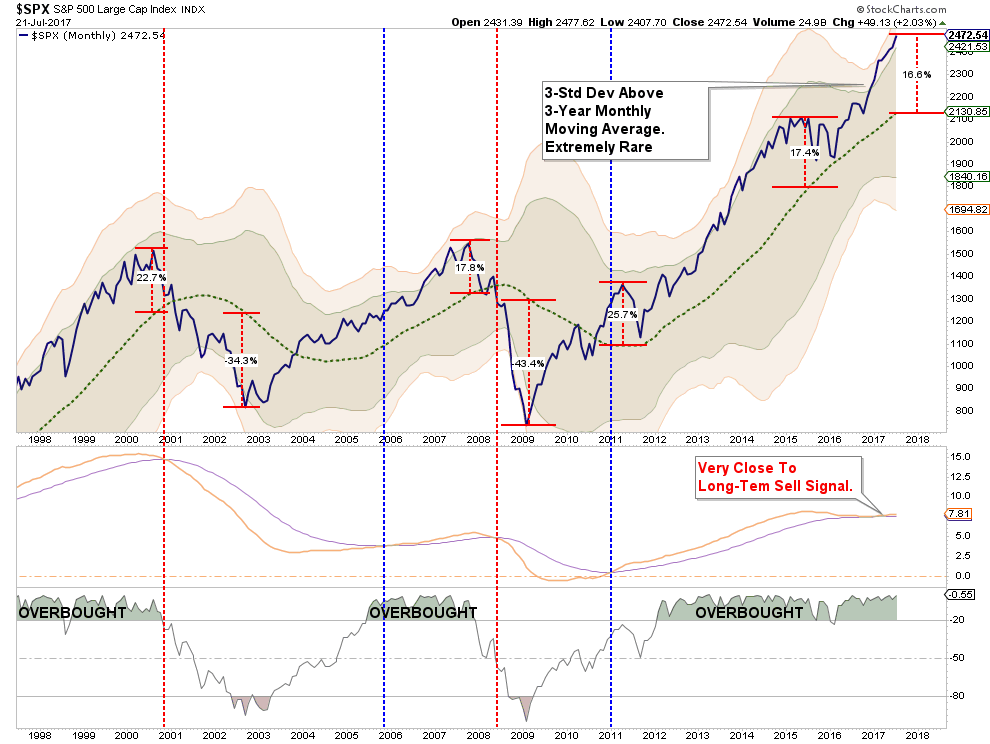
The problem, as always, is sharp deviations from the long-term moving average always “reverts to the mean” at some point. The only questions are “when” and “by how much?”
Managing Past The Noise
There are obviously many more arguments for both camps depending on your personal bias. But there is the rub. YOUR personal bias may be leading you astray as “cognitive biases” impair investor returns over time.
“Confirmation bias, also called my side bias, is the tendency to search for, interpret, and remember information in a way that confirms one’s preconceptions or working hypotheses. It is a systematic error of inductive reasoning.”
Therefore, it is important to consider both sides of the current debate in order to make logical, rather than emotional, decisions about current portfolio allocations and risk management.
Currently, the “bulls” are still well in control of the markets which means keeping portfolios tilted towards equity exposure. However, as David Rosenberg recently penned, the markets may be set up for disappointment. To wit:
“So we have a sluggish U.S. economy on our hands with growth revisions to the downside. We have a situation where some investors see the softness enduring long enough that Fed funds futures are now pricing in less than 50-50 odds that Yellen et al make another rate move by year-end. Yet the Fed is signaling that it will begin to shrink the balance sheet by the fourth quarter, with no economic liftoff.
The political backdrop is rife with gridlock — unbelievably, there is still hope among investors that tax reform is coming by 2018. At the same time, evidence is mounting that the Dems have a serious shot of taking the House next year. We have a White House that, with the help of inside leaks and the media, continues to find itself embroiled in controversies. And health care reform, which was always pledged to be the first item to be done, is looking more and more like a pipe dream. When hasn’t governing been complicated? It took the Gipper five years and endless bottles of scotch with Tip to get tax reform legislated in 1986!
We have heightened geopolitical risks from North Korea and China has instructed the U.S. that it will not be pressured to invoke sanctions against its unstable satellite.
We have a central bank chief who looks to be a lame duck…a recent WSJ survey found that economists only peg her odds of staying on past February 2018 at 20.8%. Just more uncertainty to deal with.”
Currently, there is much “hope” things will “change” for the better. The problem facing President Trump, is an aging economic cycle, $20+ trillion in debt, an almost $700 billion deficit, unemployment below 5%, jobless claims at historical lows, and a tightening of monetary policy and 80% of households heavily leveraged with little free cash flow. Combined, these issues alone will likely offset most of the positive effects of tax cuts and deregulations.
Furthermore, while “bearish” concerns are often dismissed when markets are rising, it does not mean they aren’t valid. Unfortunately, by the time the “herd” is alerted to a shift in overall sentiment, the stampede for the exits will already be well underway.
Importantly, when discussing the “bull/bear” case it is worth remembering that the financial markets only make “record new highs” roughly 5% of the time. In other words, most investors spend a bulk of their time making up lost ground.
The process of “getting back to even” is not an investment strategy that will work over the long term. This is why there are basic investment rules all great investors follow:
- Sell positions that simply are not working. If they are not working in a strongly rising market, they will hurt you more when the market falls. Investment Rule: Cut losers short.
- Trim winning positions back to original portfolio weightings. This allows you to harvest profits but remain invested in positions that are working. Investment Rule: Let winners run.
- Retain cash raised from sales for opportunities to purchase investments later at a better price. Investment Rule: Sell High, Buy Low
These rules are hard to follow because:
- The bulk of financial advice only tells you to “buy”
- The vast majority of analysts ratings are “buy”
- And Wall Street needs you to “buy” so they have someone to sell their products to.
With everyone telling you to “buy” it is easy to understand why individuals have a such a difficult and poor track record of managing their money.
Trying to predict the markets is quite pointless. The risk for investors is “willful blindness” that builds when complacency reaches extremes. It is worth remembering that the bullish mantra we hear today is much the same as it was in both 1999 and 2007.
Again, I don’t need to remind you what happened next.
See you next week.
Market & Sector Analysis
Data Analysis Of The Market & Sectors For Traders
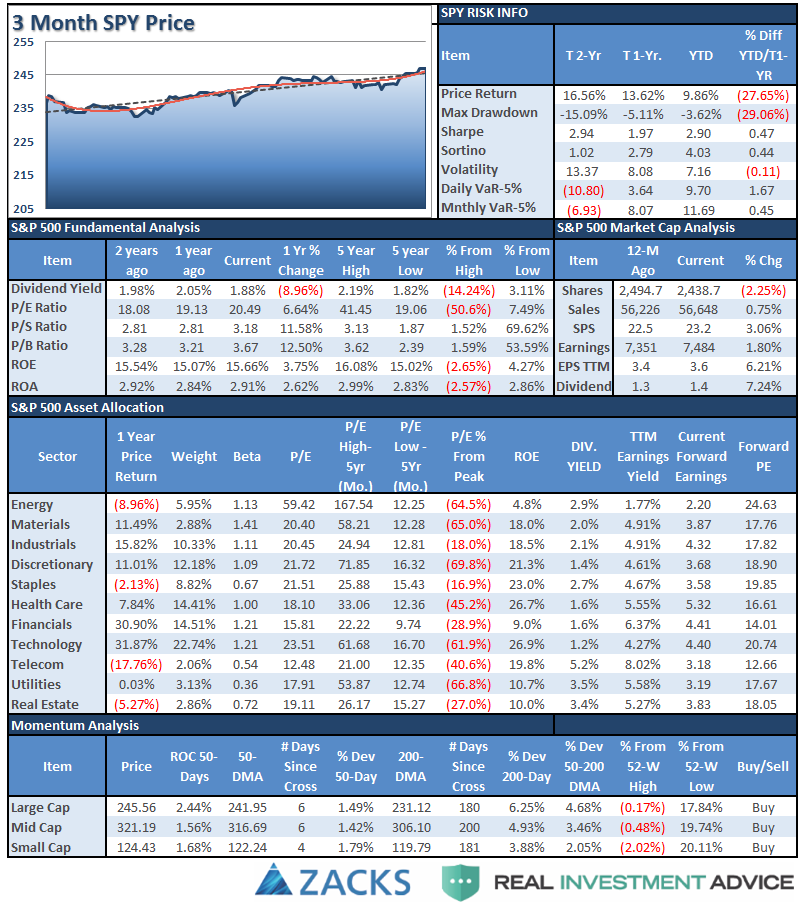
S&P 500 Tear Sheet
The “Tear Sheet” below is a “reference sheet” provide some historical context to markets, sectors, etc. and looking for deviations from historical extremes.
Performance Analysis
New! Thank you for all the comments on the performance analysis below. Due to many of the emails I got, I have swapped out the sector weight graph for a year-to-date performance range analysis. Keep the comments coming.
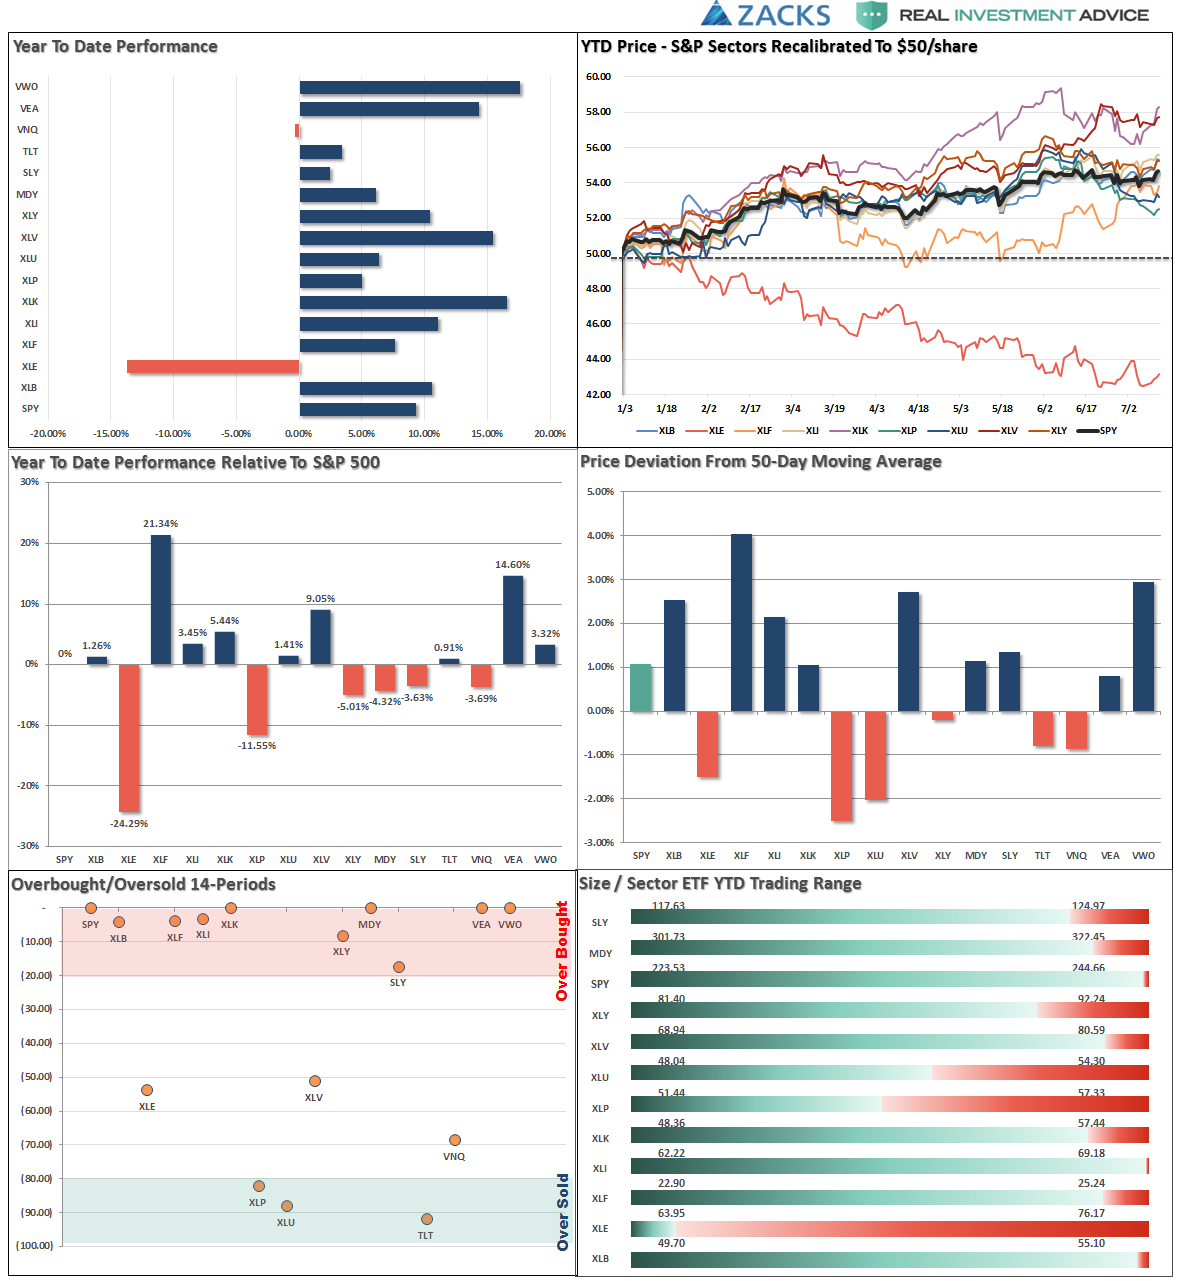
ETF Model Relative Performance Analysis
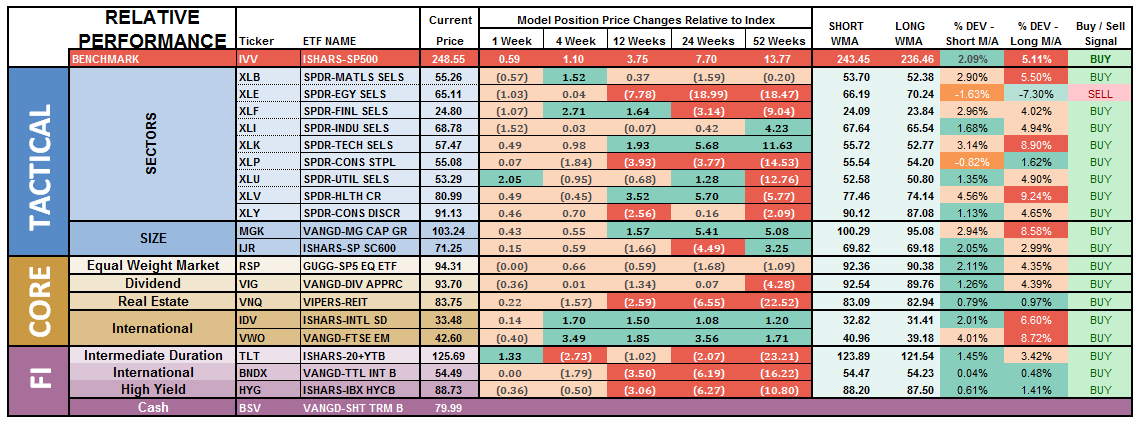
Sector Analysis:
While the markets broke out to all-time highs this past week, that breakout was not uniform across the market.
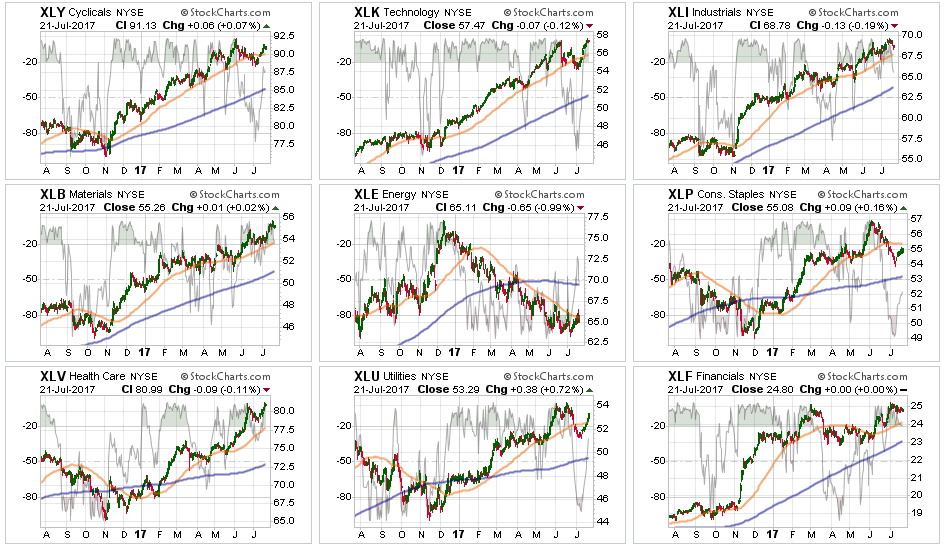
Technology, Materials, Financials, Health Care, and Industrials all hit new highs this week. However, the action faded a bit on Friday as the momentum of the advance began to wane.
Staples, Utilities, and Discretionary improved but failed to set new highs. Utilities had strong performance as bond rates fell pushing interest rate sensitive issues higher.
Energy – I have written for the past few weeks:
“Oil prices rallied last week, as I discussed in the previous newsletter, but remain trapped below resistance. Furthermore, despite the rally in oil prices, energy stocks continue their downward trajectory. The major sector sell signal, and the cross of the 50-dma below the 200-dma, remains intact keeping us out of the space for the time being. Use any rally to reduce exposure accordingly until the technical trends improve.”
The energy sector rallied this week above the 50-dma which presented a good opportunity to sell energy related exposure before closing back below resistance on Friday. With the OPEC oil deal now likely falling apart, something I suggested would happen earlier this year, oil prices crashed on Friday reinforcing resistance at $48.

Small and Mid-Cap stocks regained their respective 50-dma’s which removed their warning signs previously. This week, however, they both broke out of their long consolidation ranges pushing higher. Stops have now been moved up to the previous lows.
Emerging Markets and International Stocks as noted last week the bullish “buy point” occurred which allowed us to add international exposure to portfolios. However, the subsequent explosion of these sectors higher reduces the opportunity somewhat until there is some correction to work off the excessive overbought condition. Patience for now.
Gold – is once again trying to muster a rally from extremely oversold conditions. There is a good bit of work to do before this sector becomes interesting, but the move last week above the 200-dma does put the commodity back onto our radar for now.
S&P Dividend Stocks, after adding some additional exposure recently we are holding our positions for now with stops moved up to recent lows. With the sector becoming overbought, wait to add new exposure until a better opportunity presents itself.
Bonds and REIT’s the recent sell-off in these sectors to long-term support provided the “reasonable opportunity to add bond, and interest rate sensitive, exposure to portfolios opportunistically.” With additional exposure working well last week, we will wait and see what happens next before making any further changes.
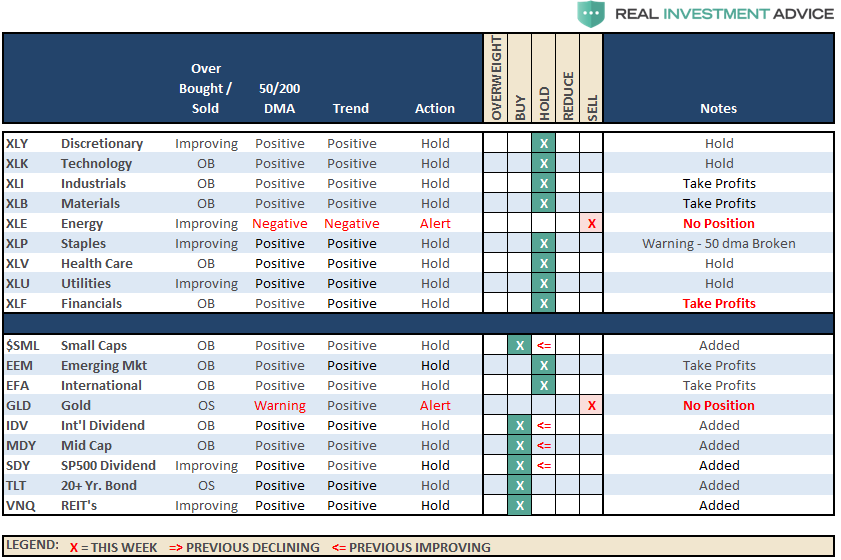
The table below shows thoughts on specific actions related to the current market environment.
(These are not recommendations or solicitations to take any action. This is for informational purposes only related to market extremes and contrarian positioning within portfolios. Use at your own risk and peril.)
Portfolio Update:
The bullish trend remains positive, which keeps us allocated on the long side of the market for now. However, more and more “red flags” are rising which suggests a bigger correction may be in the works over the next couple of months.
Two weeks ago, during the correction, we added modestly to our core holdings for the second time this year. However, we are still maintaining slightly higher levels of cash currently.
With the breakout of the market on last Friday, we are again adding to our portfolio positions and increasing exposure again this coming week. We also added to our bond holdings as well last week as rates hit our buy targets.
Stops have been raised to trailing support levels and we continue to look for ways to “de-risk” portfolios at this late stage of a bull market advance.
We remain invested. We just remain cautious and highly aware of “risks” to capital.
THE REAL 401k PLAN MANAGER
The Real 401k Plan Manager – A Conservative Strategy For Long-Term Investors
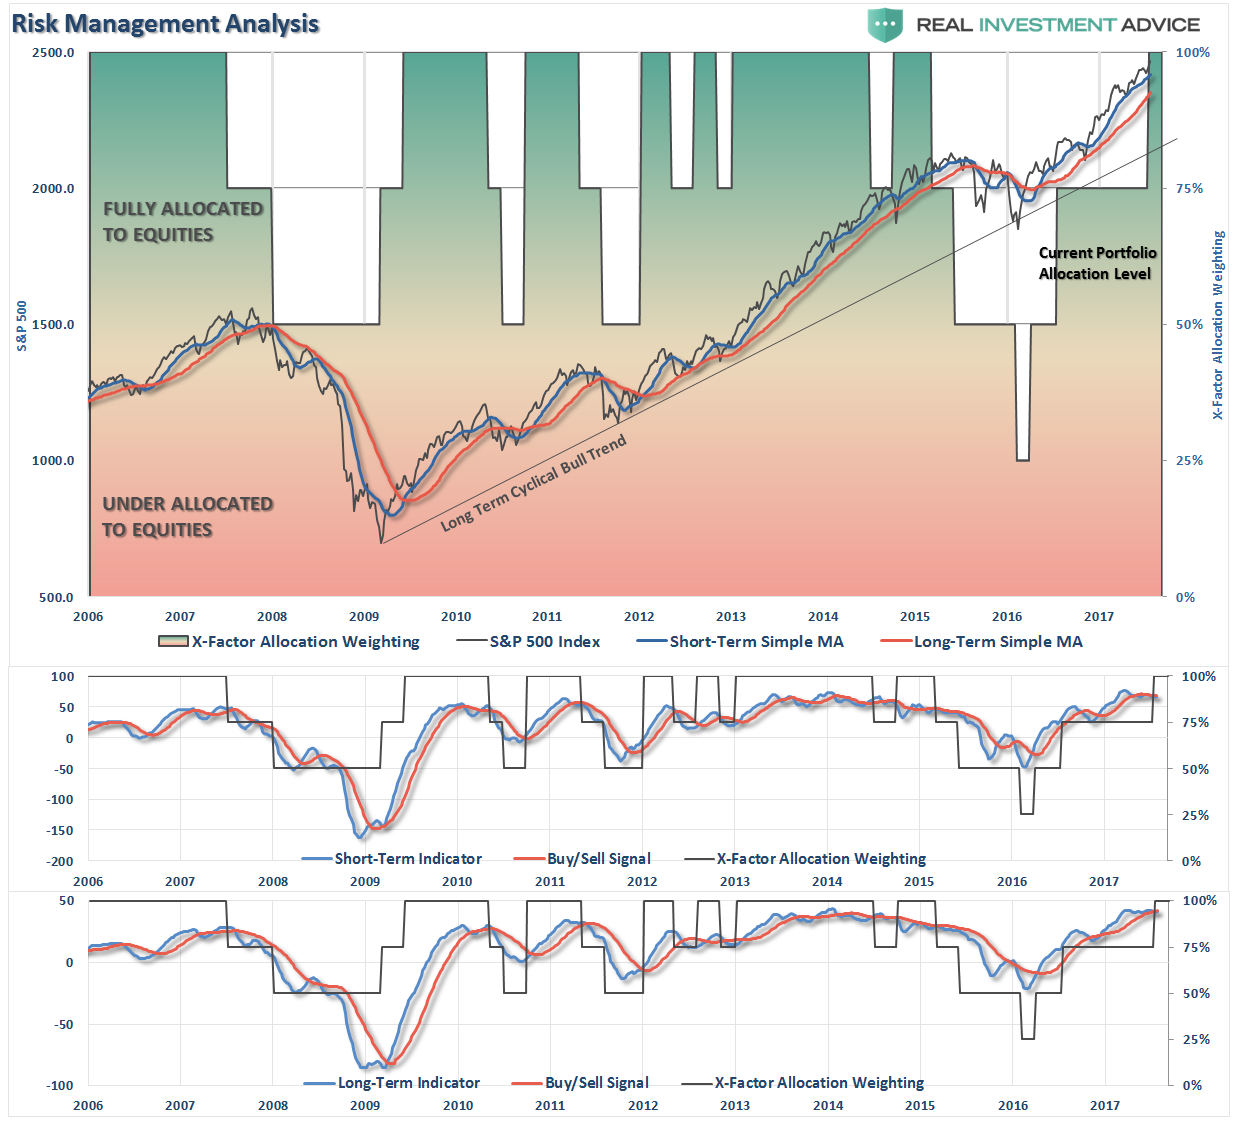
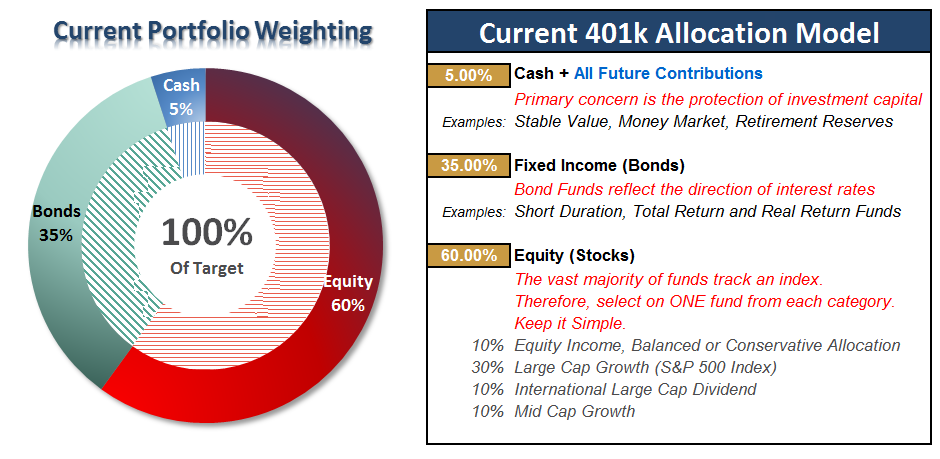
There are 4-steps to allocation changes based on 25% reduction increments. As noted in the chart above a 100% allocation level is equal to 60% stocks. I never advocate being 100% out of the market as it is far too difficult to reverse course when the market changes from a negative to a positive trend. Emotions keep us from taking the correct action.

Breakout Confirms
Last week, I increased the 401k model up to 100% because the market broke out on a technical basis, and I did so with a high degree of concern.
As I stated then:
“THERE IS NO REQUIREMENT YOU DO ANYTHING.
Since 401k plans have a limited number of options, AND have limitations as to trading, if you are NOT comfortable with the markets current backdrop, particularly as we head into the last two months of summer, there is no requirement for you to make changes. This model is simply a guide.”
However, with that said, I did adjust the model to reflect the current “break out” of the market and increased exposure accordingly.
This is not a market currently to be trifled with as the overbought and overly bullish conditions remain at extremes with investors chasing momentum with complete disregard to the underlying risk. However, the markets are advancing and the push higher this week confirmed the breakout.
Furthermore, we also added bond exposure to portfolios as well. Importantly, there is a high degree of correlation between all asset classes. This is particularly disturbing as such a degree of correlation suggests that diversification will not shield investors against losses. This is why we continue to reiterate a regular reassessment of portfolio related risk and positioning. Stop loss levels should be moved up accordingly.
Current 401-k Allocation Model
The 401k plan allocation plan below follows the K.I.S.S. principle. By keeping the allocation extremely simplified it allows for better control of the allocation and a closer tracking to the benchmark objective over time. (If you want to make it more complicated you can, however, statistics show that simply adding more funds does not increase performance to any great degree.)
401k Choice Matching List
The list below shows sample 401k plan funds for each major category. In reality, the majority of funds all track their indices fairly closely. Therefore, if you don’t see your exact fund listed, look for a fund that is similar in nature.

Disclosure: The information contained in this article should not be construed as financial or investment advice on any subject matter. Streettalk Advisors, LLC expressly disclaims all liability in ...
more


Thanks for sharing