
ADRs Best & Worst Report - January 26, 2015
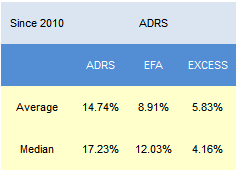
Since 2010, the average return of our weekly best scoring ADRs have outpaced the MSCI EAFE by a median 416 bps over the following year, with no turnover.
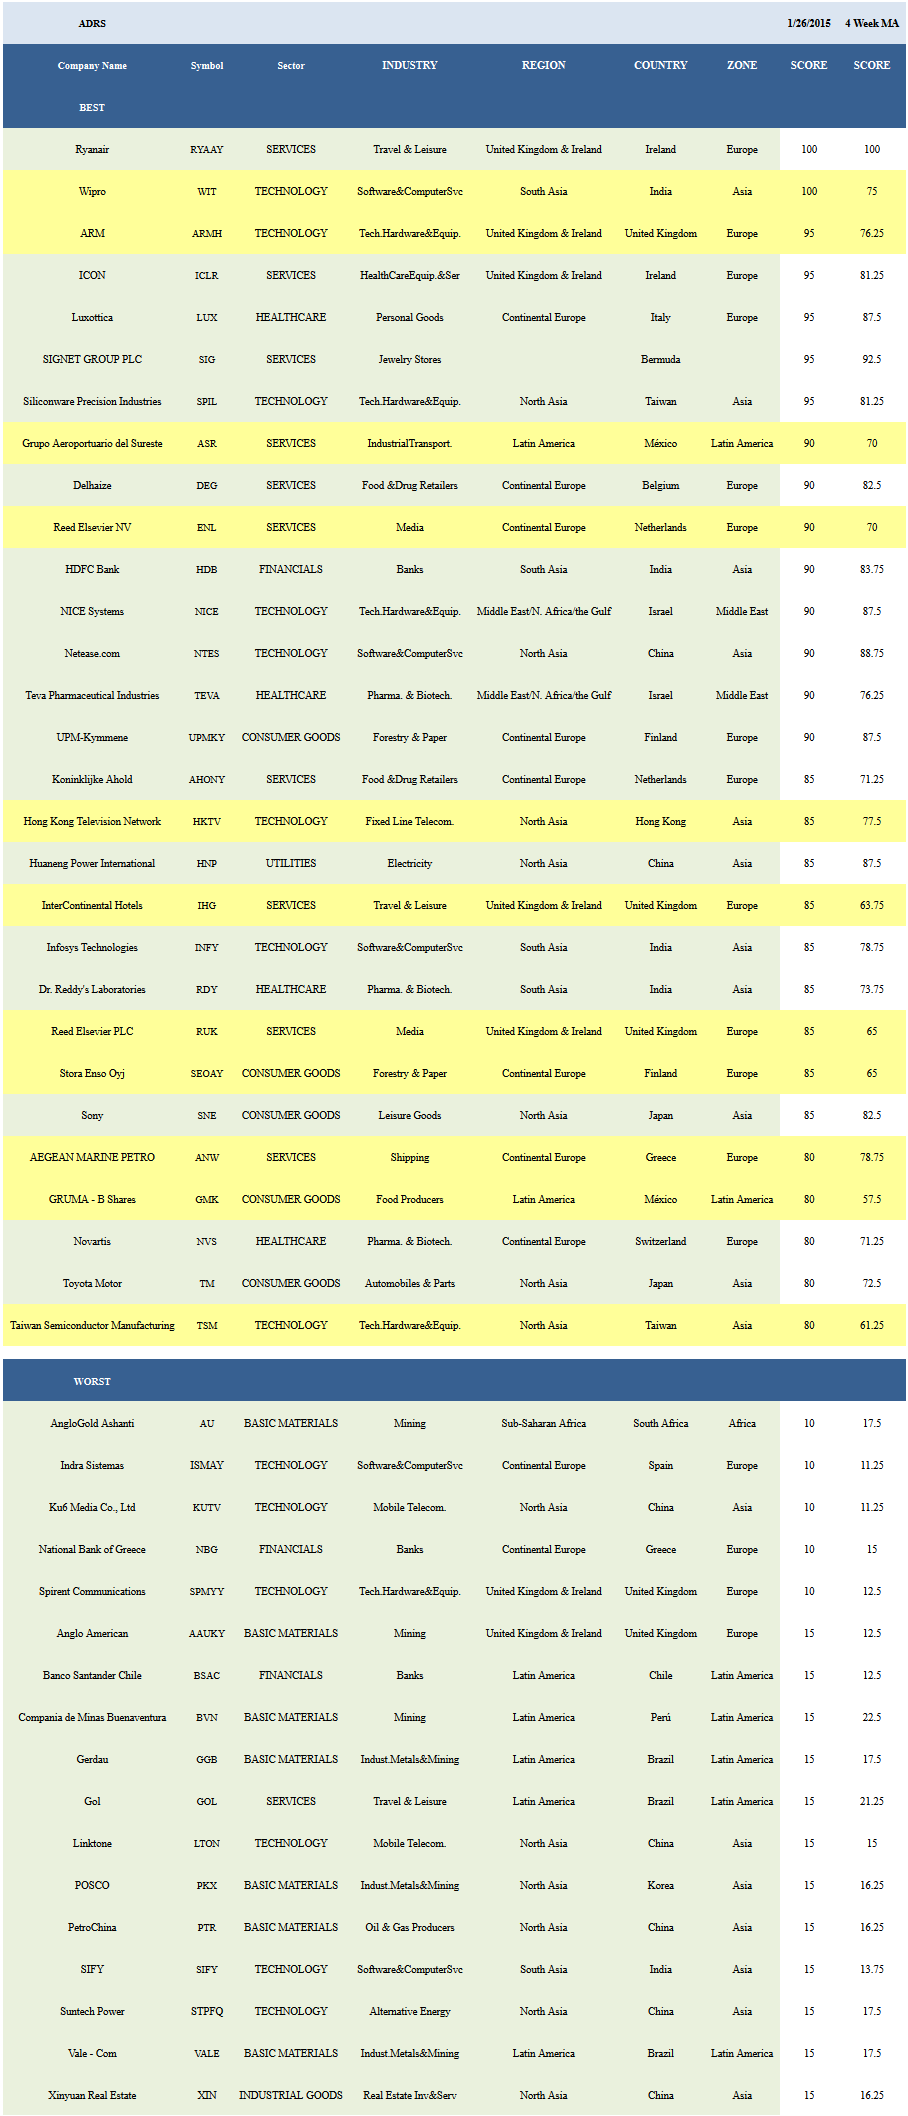
The average ADR score is 47.65, which is above the four week and eight week moving averages of 44.61 and 45.67. The average ADR is trading -24.58% below its 52 week high, -6.03% below its 200 dma, has 3.27 days to cover held short, and is expected to grow EPS by 14.57% next year.
Click on picture to enlarge
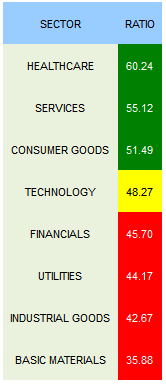
The best scoring ADR sector is healthcare (LUX, TEVA, RDY, NVS, PSDV, BAYRY). Services (RYAAY, SIG, ICLR, ENL, DEG, ASR, RUK, IHG) and consumer goods (UPMKY, SNE, SEOAY, TM, GMK, TTM, BUD, DDAIF) also score above average. Technology scores in line with the average ADR universe. Financials, utilities, industrial goods, and basic materials score below average.
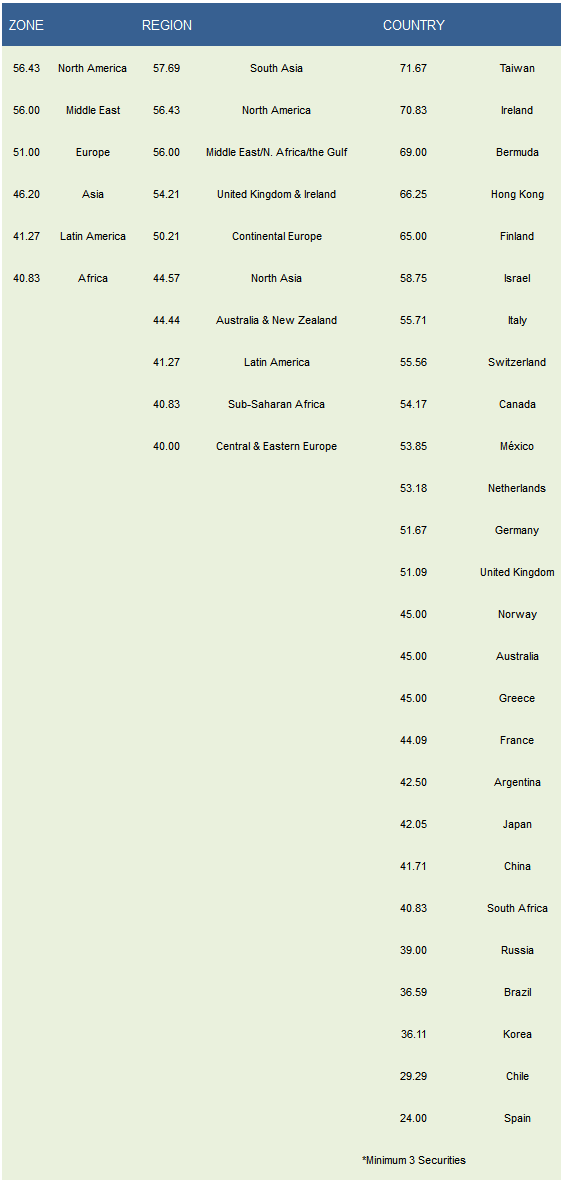
The top scoring zones are North America/Canada (PSDV, RY, BMO, BCE) and the Middle East (NICE, TEVA). The best regions are South Asia (WIT, HDB, INFY, RDY, TTM, IBN), North America, and MENA. The top countries are Taiwan (SPIL, TSM, ASX), Ireland (RYAAY, ICLR, CRH), Bermuda (SIG, AXS), Hong Kong (HKTV, MPEL), and Finland (UPMKY, SEOAY).
Disclosure: None.


