
ADRs Best & Worst Report - February 1, 2016
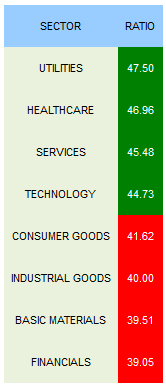
- The best sector across ADRs is utilities.
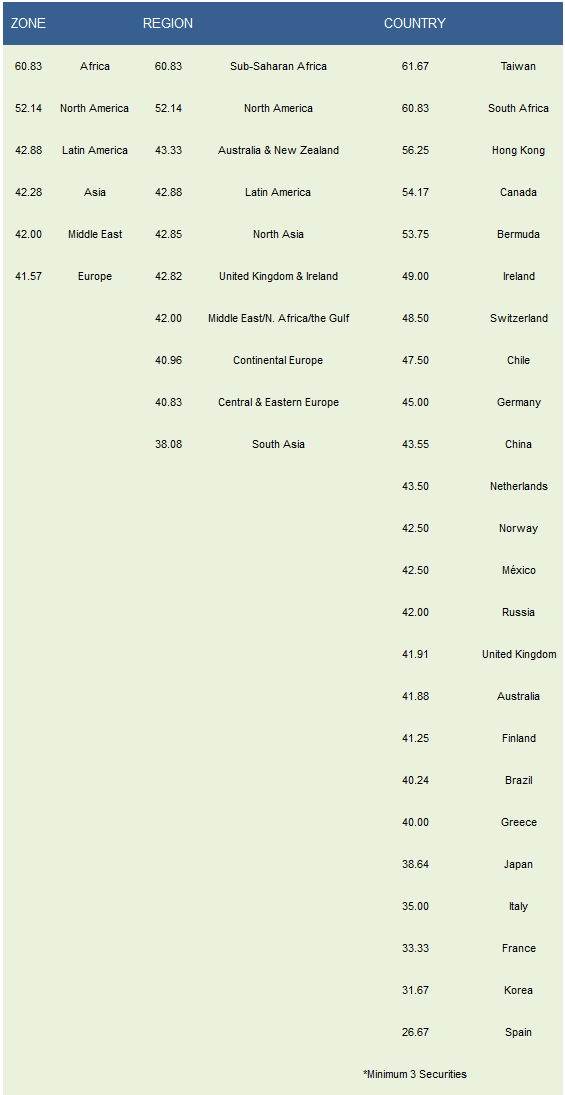
- The top regions are Sub-Saharan Africa, No. America, & Australia/NZ.
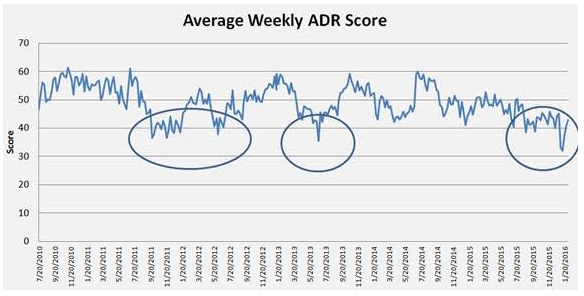
The average ADR score is 42.81 and that's up from 40.75 last week and the low of 32.01 on 1/11/2016. The average ADR is trading -33.21% below its 52 week high, -9.99% below its 200 dma, has 3.64 days to cover held short, and is expected to grow EPS by 8.59% in the coming year.
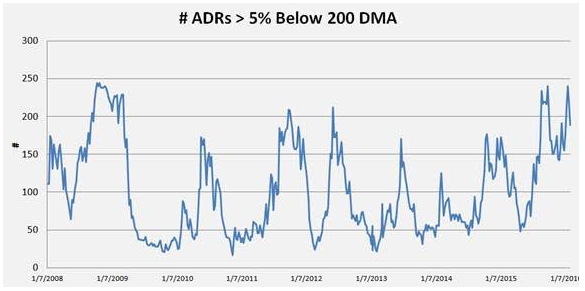
As we've pointed out since early January, average score and the number of ADRs trading more than 5% below their 200 dma can offer helpful clues as to actionable buy points. Historically, an average score below 40 coincides with a short term market low. Similarly, it's also bullish when a significant number of ADRs get more than 5% below their 200 dma.
This first chart shows historical average ADR scores in the post-recession period.
This next chart shows the number of ADRs trading more than 5% below their 200 dma going back to 2008. Readings above 200 have been actionable in the past.
The following table shows which ADRs score best and worst in our universe.
(Click on image to enlarge)
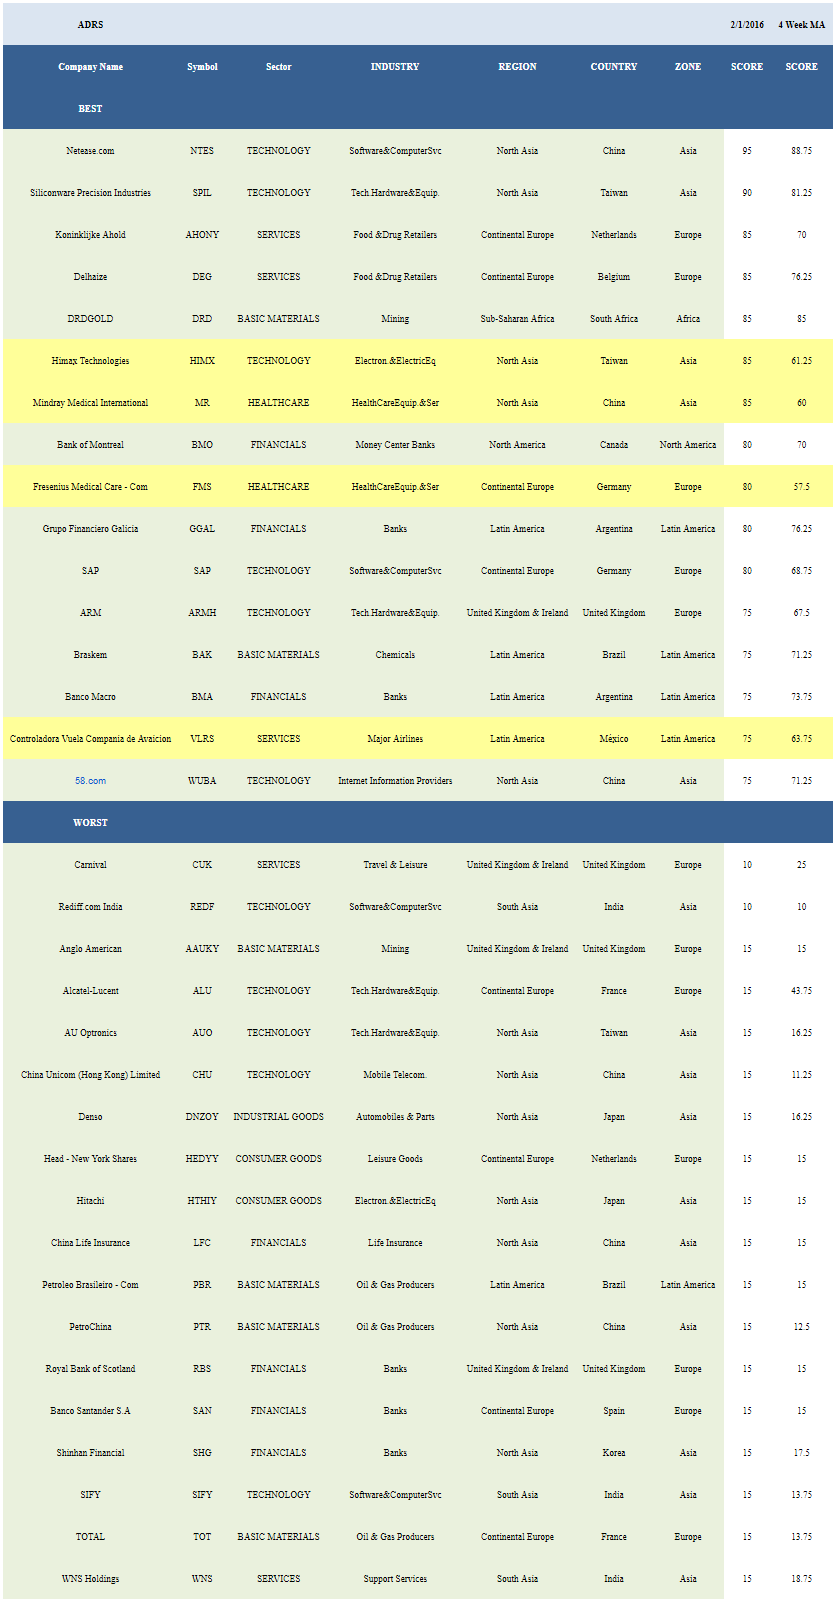
Overall, the best sector across ADRs is utilities (CPL, SBS). Healthcare (MR, FMS, TEVA, RHHBY, NVO, LUX), services (DEG, AHONY, VLRS, SFL, ICLR, HMIN, EDU, CTRP, BSYBF, UGP, SKYAY, PAC, NCTY), and technology (NTES, SPIL, HIMX, SAP, WUBA, ARMH, TSM, SMI, OIIM, NTT, NICE, JST, DCM, CMCM, ASX) also score strong. Consumer goods, industrial goods, basic materials, and financials score below average.
The best zones are Africa (DRD, GOLD, HMY) and No. America (BMO). Sub-Saharan Africa, No. America, and Australia/NZ (WBK, NZTCY) are the top regions. Taiwan (SPIL, HIMX, TSM, ASX), So. Africa (DRD, GOLD), Hong Kong (SMI, OIIM), Canada (BMO), and Bermuda (SFL) are the top countries.
Disclosure: None.


