ADRs Best & Worst Report - August 24, 2015
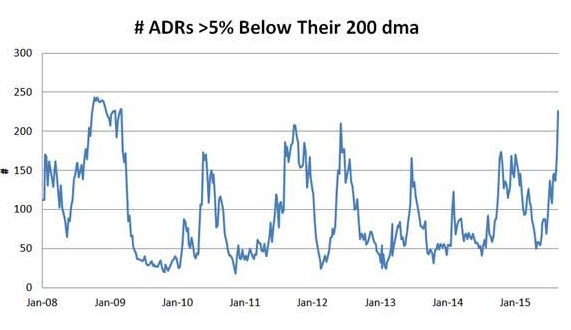
The following chart shows the # of ADRs in our ADR universe trading >5% below their 200 dma. Since 2008, risk/reward has shifted to buyers when this contra trend reading gets to between 150 and 200. This week's reading is 226.
The next chart shows the average ADR score post Great Recession. Scores are their lowest since summer 2013 and are at/near levels coincident with previous strong buy opportunities -- begin deploying cash, but recognize that margin call headwinds may still cause problems over the coming days/week.
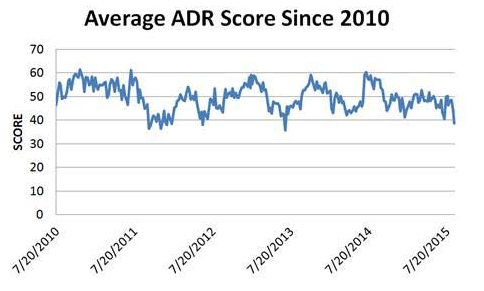
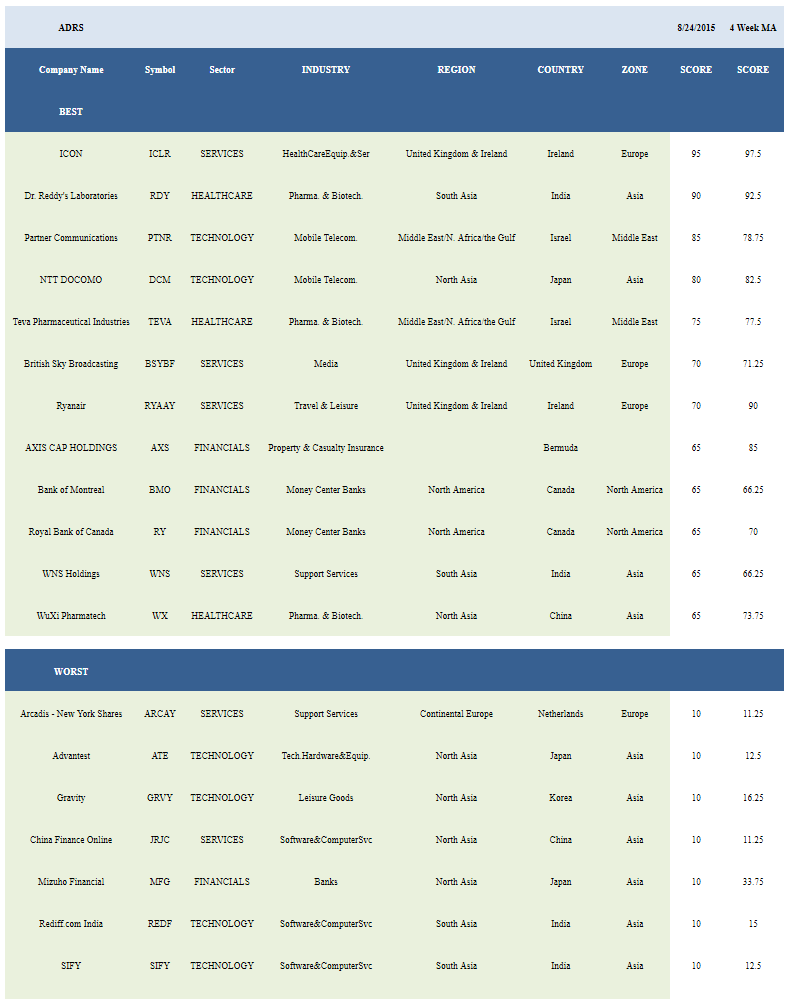
The average score across our ADR universe is 38.65 and that is unsurprisingly below both the four and eight week average score of 44.84 and 45.77, respectively. The average ADR fell 9% in the past week and is now trading -33.9% below its 52 week high, -16.19% below its 200 dma, has 4.07 days to cover held short, and is expected to post EPS growth of 13.9% in the coming year.
Click on picture to enlarge
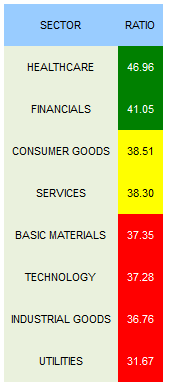
Healthcare (RDY, TEVA, WX, FLML, NVS, NVO, FMS, LUX) is the strongest sector in ADRs. Financials (RY, BMO, AXS, CS, HDB, BCS) can also be bought. Consumer goods (NSRGY, REXMY, NTZ, HEINY) and services (ICLR, RYAAY, BSYBF, WNS, VLRS) score in line with the average ADR universe score. Basics, technology, industrials, and utilities score below average.
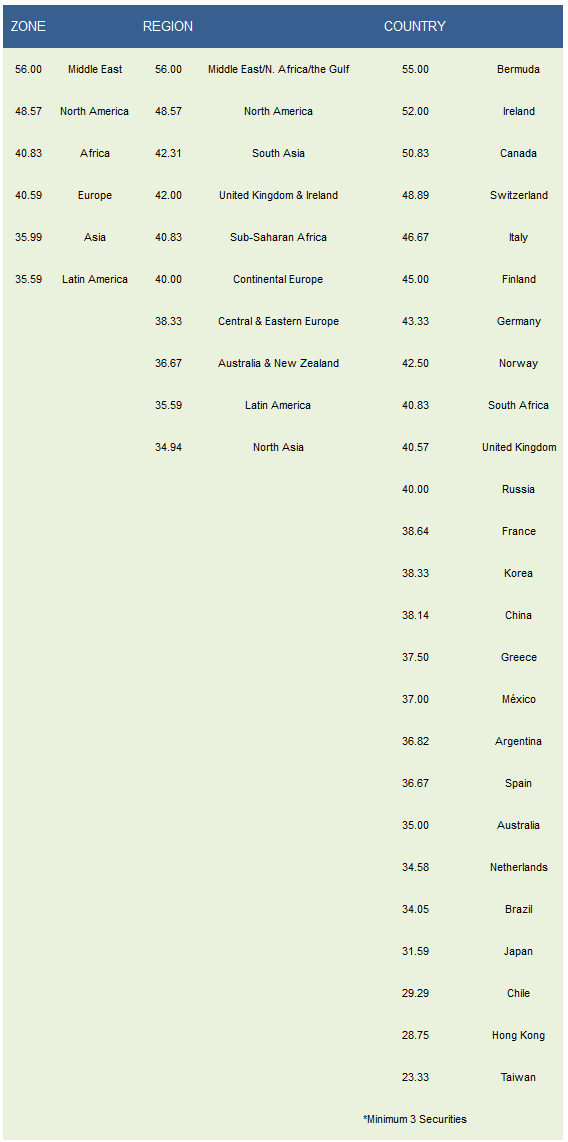
The Middle East (PTNR, TEVA) and No. America (RY, BMO, BCE) are the best zones. MENA, No. America, and South Asia (RDY, WNS, INFY) are the top regions. Bermuda (AXS, GSOL), Ireland (ICLR, RYAAY), Canada (RY, BMO), Switzerland (CS, NSRGY, LOGI, NVS), and Italy (TI, NTZ, LUX) are the strongest countries.
Disclosure: None.


