
Adding Up The Pieces For The Weekly Trade: Volatility, Yield Curve, Tariffs
S&P 500 Expected Move & Lacking Moves of 1%
The S&P 500 made gains each day of the prior trading week, ending with a weekly gain of 1.16 percent. The index is up 7.76% year-to-date. Despite all the macro and geopolitical concerns persisting through much of 2018, the S&P 500 is having another healthy year and is on track to once again deliver double-digit gains. Of course, there may still yet be a set back for the benchmark index, which only fails in performance level when compared to the Nasdaq (NDX).
The SPX expected move for the coming week is only $30. I say “only $30” because the prior week’s expected move was $42, which failed to be achieved by only a couple of dollars and prior to Friday morning headlines on Trump’s tariffs to be levied on $200bn in Chinese imports.
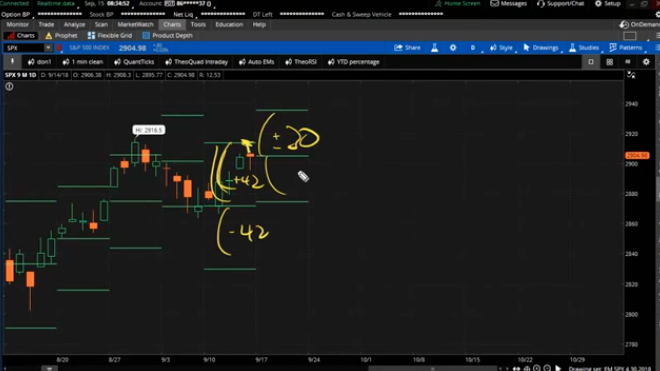
Nonetheless, the expected move was not breached once again. The expected move has only been breached 3 times in the last 24 weeks. If any investor questioned the usage and relevance of quant and/or mechanical trading in the marketplace, look no further for evidence than the current trends in the weekly expected moves.
After coming off a rather complacent month of August, gauged by the lowest VIX median reading since 1967, the VIX has continued with the theme of complacency in the early parts of September. After a brief and modest pick-up in volatility during week 1 of September, the VIX has once again resumed its decline in week 2 of September and with the VIX breaking below 12 on Friday of last week, before closing out the week at 12.07.
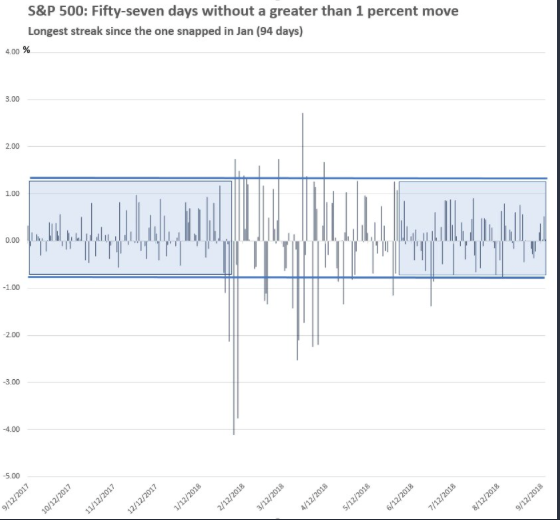
Given the consistent sub-15 VIX reading for the last couple of months now, the S&P 500 has expressed 57 consecutive trading days with less than a 1% daily move. As shown in the graph above, the current streak is lesser than that of the 94-day streak snapped in January of this year. With the current VIX reading of just 12%, a pick-up in volatility will need to persist in order for the current streak to be snapped.
Yield Curve Inversion-Potential for VIX to Rise
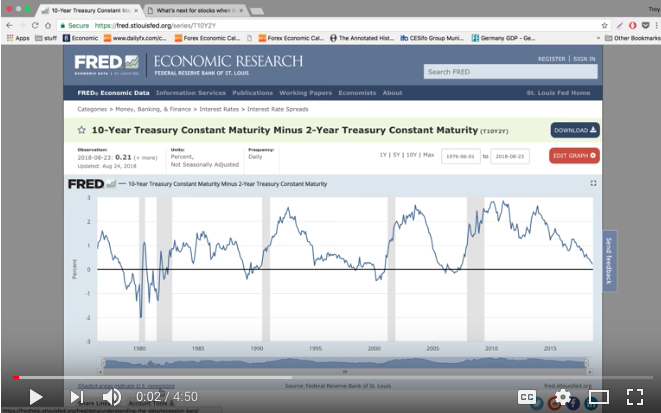
There are always variables that can breed an increase in volatility from week-to-week and some of those variables may occur near-term. Yield curve inversion may prove to be the main driver of future market unrest, at least momentarily. Firstly, what is yield curve inversion? Yield curve inversion occurs when and where short-term yields (2yr T-bill) and long-term yields (10yr T-bill) move closer together and eventually the short-term yields are higher than that of the long-term yields. This happens as shorter-term yields rise following Fed’s rate hikes but long-term yields refuse to budge.
What will likely cause angst amongst the investor community is the fear of what is to come once the yield curve inverts and not the actual economic impact resulting from an inverting of the yield curve. In other words, even though a recession isn’t in the cards any time soon, due to the yield curve inverting, the fear can produce a negative feedback loop in the equity markets. As such, the markets can retrench with a resulting rise in volatility from the fear.
With the aforementioned subject matter on the yield curve, here are some useful insights denoted and depicted in Troy Bombardia’s recent YouTube video.
In addition to the insights delivered in the YouTube video, rooted in historical, factual data, here is some number crunching offered by Ryan Detrick of LPL Financial.
A couple of final thoughts on the probable yield curve inversion within the next 30 days: History may not prove a guide for the current yield curve inversion occurrence as there has never been tax reform this late in an expansionary cycle. Although the yield curve will likely invert near-term, it will invert at extremely low yielding levels and with corporate earnings growing near decade-high levels. In other words, this time is very different, but we’ve yet to discover whether or not the noted differences will result in a different outcome for the economy and equity markets once the yield curve does in fact invert.
Big Money Positioning
Heading into the trading week of September 17th, the 10-year yield is at 3 percent. This may cause some investor anxiety.
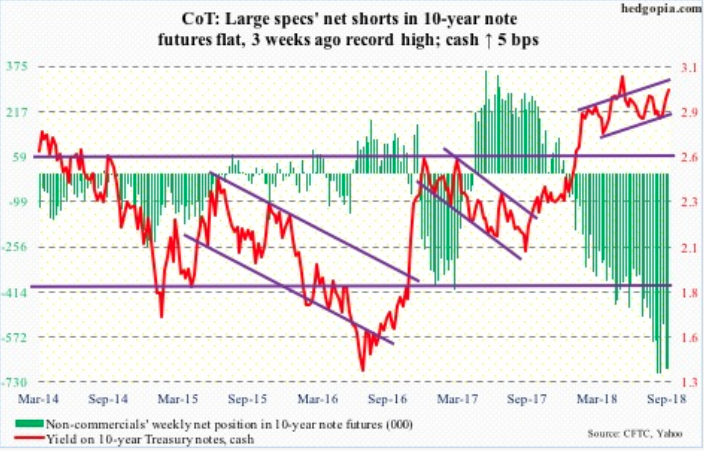
As depicted in the chart above from Hedgopia, Net shorts are near all-time highs. The question is, "What happens medium-to-long-term?" Since peaking at 3.12% in May, the 10-year has made lower highs, although it is attempting to break out of a 4-month channel drawn from that high.
Given the focus on the probable yield curve inversion and possibility for fear to ramp up as the FOMC prepares for its next rate hike, let’s take a look at how hedge funds are positioned with respect to VIX Futures. Keep in mind that this week marks VIX Futures expiration.
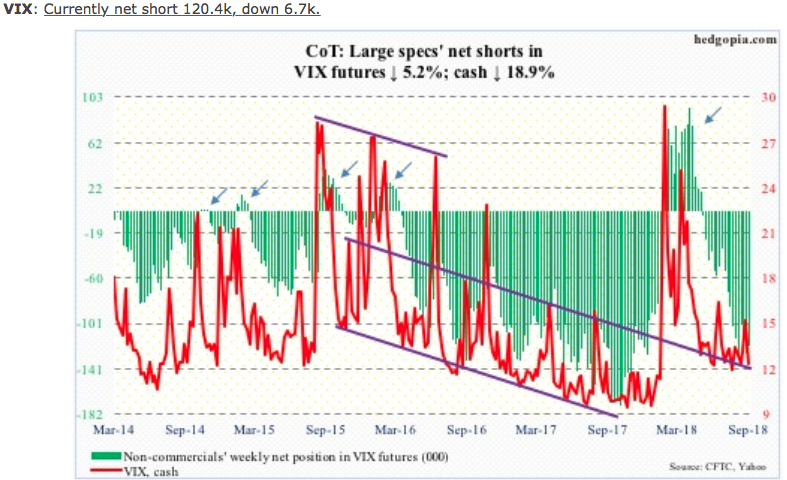
Based on the chart above, the VIX fell in all five sessions last week. Since the VIX shot up intraday to 50.30 on February 6th, it has persistently made lower highs. Volatility bulls can point to the fact that in the past five months VIX has found support in the 11s. With that, let’s take a look at some fund flow data as another way of identifying how hedge funds have been positioning.
Fund flows continue to show a flight to safety in recent weeks, according to Lipper fund-flows. For the week ended Wednesday, September 12, 2018, investors focused on the escalating trade-war rhetoric between the U.S. and China and the large currency declines for Argentina and Turkey. For the second week in three investors were net redeemers of fund assets (including those of conventional funds and ETFs), withdrawing $3.3 billion. Fund investors added to taxable fixed income funds (+$2.4 billion), but were net redeemers of money market funds (-$3.8 billion), equity funds (-$1.8 billion), and municipal bond funds (-$136 million).
Investors continue to mitigate the risk surrounding trade and geopolitical concerns causing many investors to take a risk-off approach to investing.

As capital has come out of equity markets, fund investors have injected some $39.5 billion net YTD into government-Treasury funds (consisting of the Lipper classifications below), in line to be the largest one-year net inflows into this group on record.
Monthly Retail Sales
Just last Friday the August retail sales report was delivered by the Census Bureau. It was a big miss, right? Well, that depends on who does the reporting. The following headline comes from the perma bear camp of ZeroHedge:

And then there is the more market-neutral camp headline from MarketWatch as follows:
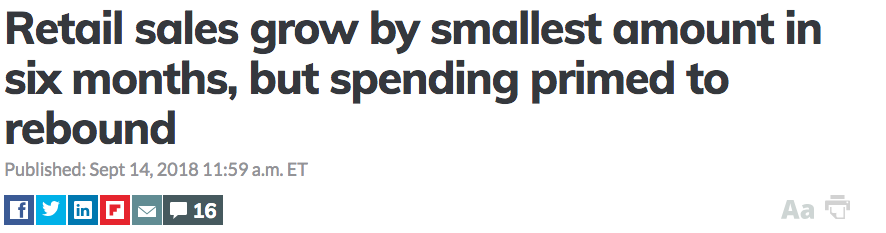
These are somewhat contrasting headlines so let’s dig into the facts; what was actually reported by the numbers. Retail sales grew by a scant 0.1% in August, the government said Friday. Economists polled by MarketWatch had forecast a 0.3% increase. Reuters forecasted sales to rise .4 percent. ZeroHedge suggests the forecast to be as high as .5%, but of course, they fail to source that forecast. Typical of ZeroHedge! According to the release and the many forecasts, the numbers came in light of expectations. There is no argument there, but… well we will get to that in a bit.
Retail sales for the month-to-month report in August would have been worse if not for a 1.7% spike in spending at gas stations. Retail sales omitting car fuel fell 0.1 percent. Having said that, retail sales were upwardly revised to show a 0.7% increase instead of 0.5% for the month of July. So if we take the upward revision of .2% to July and the .2-.3%, depending on who’s forecast one relies upon, the August miss was more a factor of failed forecasting largely due to revisions to the July report. In total, the 2-month forecast would have been spot on with respect to forecasts and equating to the YOY growth expectation for retail sales.
Moreover, the YOY retail sales were the most astounding part of the data. Of course, nothing gives the monthly report of retail sales more justice than the chart of annual retail sales as follows:

Even after the slowdown in August, retail sales are still growing rapidly. They’ve climbed a healthy 6.6% in the past 12 months. Tax reform, hiring, low unemployment, relatively low-interest rate levels, improved debt to income ratios due to increased wages and a strong consumer sentiment have led to some of the strongest gains in retail sales in many years.
“Consumers are in excellent shape heading into the fall of 2018,” said chief economist Gus Faucher of PNC Financial Services. “The fundamentals are positive: strong job growth, accelerating wage growth, sturdy household balance sheets, and increasing wealth thanks to rising stock prices and home values.”
Now let’s take a look at the breakdown of the Census Bureau’s report in the table below:
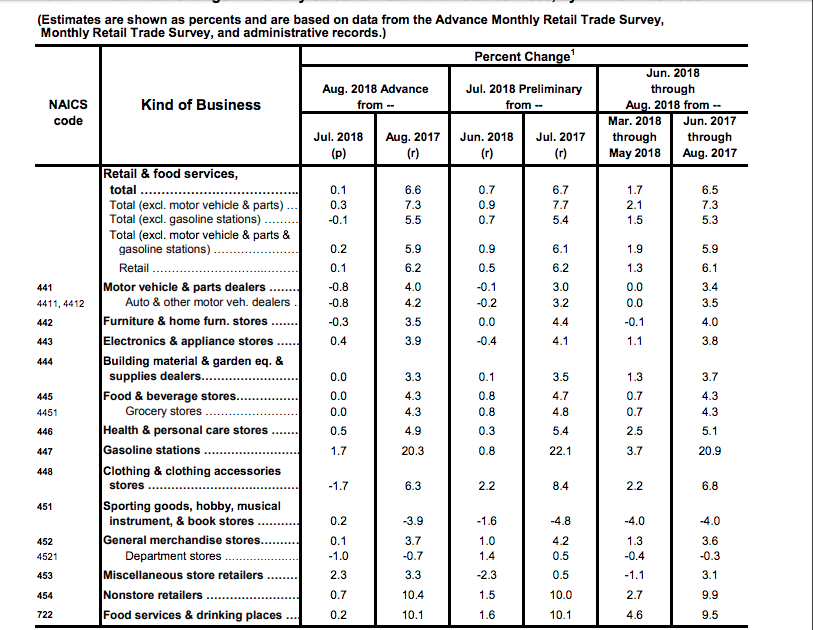
I have previously reported and warned investors about the supposed or assumed resurgence in the department store category of retail sales. Based on the Census Bureau’s reporting, one can discern that the only category with both MoM and YOY declines in sales is department store sales. This is concerning on a longer-term basis as the comparisons from a year ago were already quite low or what was assumed to be trough levels. And why are department stores continuing to suffer? One need only look at the MoM and YOY results in the Nonstore (online/digital) retail sales category. The category continues to grow at a double-digit rate year-over-year, siphoning sales from the department store category. Another poorly performing category continues to be Sporting goods, hobby, musical instruments and bookstore sales.
What is going to continue to be critical for department store retailers is how quickly they can scale their digital sales channel while curbing their losses from traditional storefronts. A great deal of the “curbing of losses” continues to come from inventory reduction activities by department stores such as Macy’s (M ), Kohl’s (KSS), J.C. Penney (JCP) and the like. While Macy’s and Kohl’s stock performance has painted a rosy picture for investors in 2018, the longer-term story of decaying retail inventory sq. footage tells a very different tale. Where their greater same-store sales is coming from and will likely come from further highlights that tale-telling.
Investor Takeaways
Economic data, corporate earnings data and projections continue to come in strongly, but it’s clear that fear is looming underneath the equity markets. Fund flows YTD suggest that the fear of missing out on equity performance is of lesser consequence than capital preservation even with earnings on the rise. Thomson Reuters now forecasts Q3 2018 S&P 500 to grow 21.7% vs. the year-ago period. FactSet now expects the same period to express 19.9% YOY corporate earnings growth. Both reporting agencies have lowered their Q3 2018 forecast slightly from the prior week. Having said that, the growth is still at highs not seen since 2010 and gives supportive reasoning for current and forward-looking market valuations.
Many media reporting outlets are suggesting that the U.S. administration is probably going to announce the implementation of $200 billion in tariffed goods from China as early as Monday. The sources have been unconfirmed and the actual announcement remains in limbo after Friday’s announced backing of such tariffs. Ultimately, the 10% tariff on $200 billion of China’s imports amounts to very little to either country. But from that point, the fear rises with regards to “what comes next” in the spat between the two nations and with a new NAFTA deal still yet to be reached. The geopolitical stakes are high and ratcheting up further as we enter the back half of September in the equity markets.


What I think I see in this posting is an assertion that certain paths will be followed because that is how it always works. Yet, in every shareholder report document, in big bold print, we see "past performance is no guarantee of future performance." I can believe that, so why spend ink claiming the opposite?
Inform me as to where you've determined this assertion in my verbiage. Trolling is not acceptable. Based on what "I think I see in this comment".