
Above The 40 – The Stock Market’s Bearish Divergence Resolves Into Broad Selling
AT40 = 35.0% of stocks are trading above their respective 40-day moving averages (DMAs)
AT200 = 48.9% of stocks are trading above their respective 200DMAs
VIX = 16.0 (volatility index)
Short-term Trading Call: neutral
Commentary
The sellers finally put on a show complete with follow-through and a strong finish.
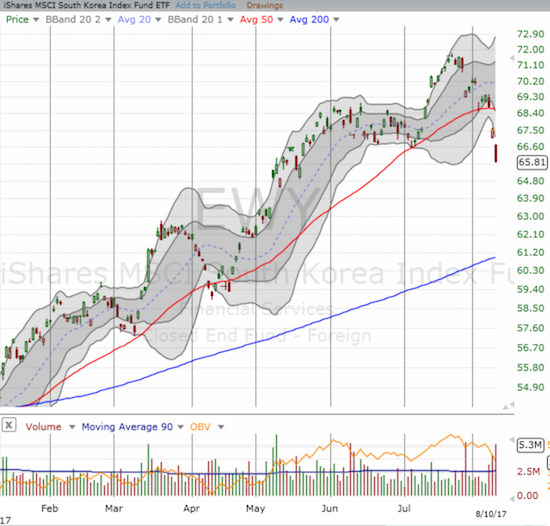
The iShares MSCI South Korea Capped ETF (EWY) confirmed a rare 50DMA breakdown in a sign that market participants may actually be thinking something is amiss on the Korean peninsula. EWY is down 7.5% from 2017’s high but still up 23.7% year-to-date.
The S&P 500 (SPY) cleaved right through support at its 50-day moving average (DMA) to end the day with a 1.5% loss. The Nasdaq and PowerShares QQQ Trust (QQQ) each similarly broke down with losses of 2.1%.
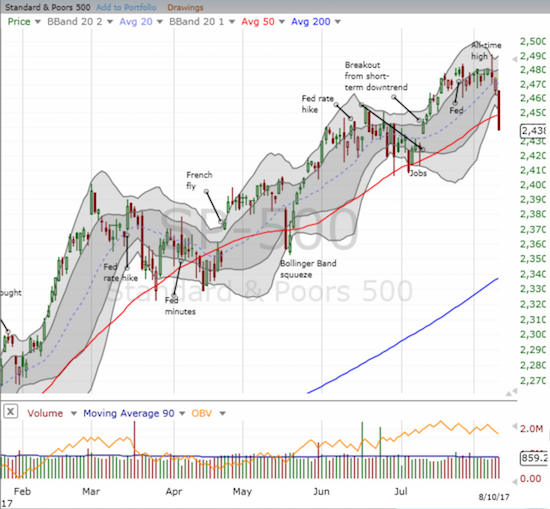
The S&P 500 (SPY) is on its fifth period tripping below 50DMA support in 2017. Sellers gave up very quickly on the last 4 trips…
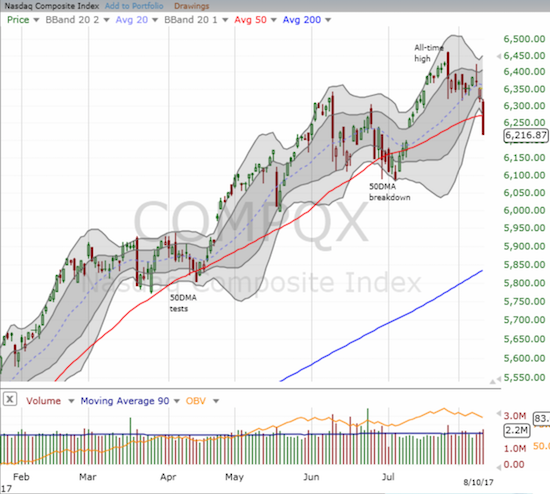
The Nasdaq is only on its third period below 50DMA support this year.
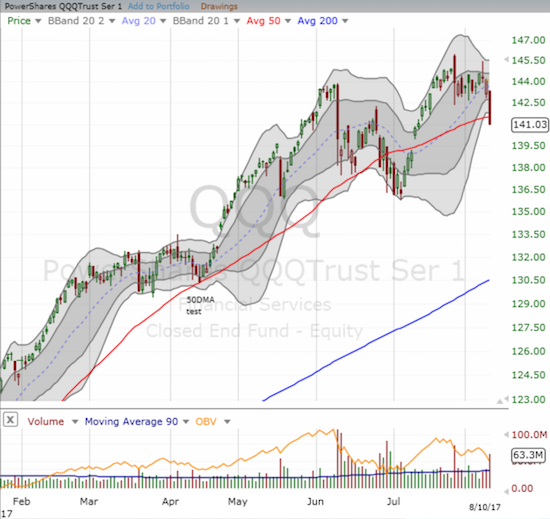
The PowerShares QQQ Trust (QQQ) is only on its SECOND breakdown below 50DMA support for 2017.
These breakdowns represent a rapid resolution to the bearish divergence that brewed all month and came to a head on Wednesday. While this swoon is just one day of selling so far, it provides yet one more powerful example of the importance of paying attention to bearish divergences. For many who do not use the tool of AT40 (T2108), the percentage of stocks trading above their 40DMAs, today’s sell-off came as a complete surprise; perhaps the selling even seems like a complete contradiction to all the days the market spent yawning about the very things used to explain this sell-off (now mainly the heating warlike rhetoric between U.S. President Donald Trump and North Korean President Kim Jong Un). With AT40 in full view, even the casual observer could take note of the deteriorating health of the market hidden by the performance of the major indices.
The volatility index, the VIX, put on the most impressive show. The VIX soared 44.4% to close at 16.0 and solidly above the all-important 15.35 pivot. The VIX secured its highest close of the year and its highest close since last year’s Presidential election.
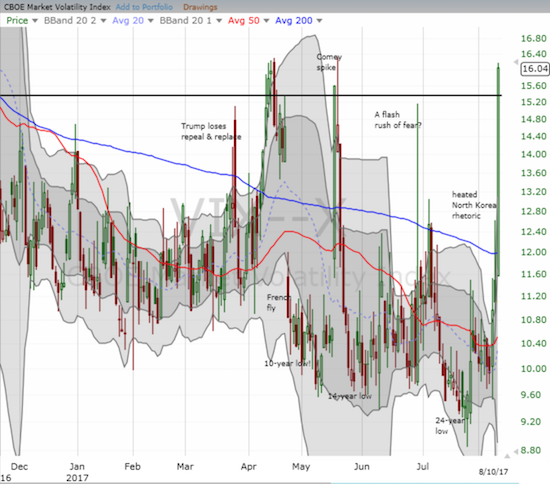
The volatility index, the VIX, hitting a closing high for the year. Can THIS spike last for more than a few days?
The soaring VIX catapulted the ProShares Ultra VIX Short-Term Futures ETF (UVXY) to a 26.7% gain. I of course wish I had held the UVXY call option I sold on Wednesday, but the gains on my call options on ProShares UltraShort S&P500 (SDS) almost made up for the lost opportunity. I locked in a near double on those call options and added one more call option on ProShares Short VIX Short-Term Futures ETF (SVXY). The SVXY position transitioned from a hedge to an early bet on the next implosion of volatility.
If recent history holds, this VIX spike will last just a few more days at best. AT40 is low enough to help confirm a repeat of history. At 35.0%, AT40 is at a 2017 closing low and has not been this low since…last year’s Presidential election. In other words, AT40 is “close enough” to oversold where buyers will feel bold enough to start shopping for “bargains.” Just another two or three days of selling could easily drive AT40 into official oversold status (below 20%). AT200 (T2107) is also at a 2017 closing low which has not been seen since last November.
Apple (AAPL) is perhaps the signature example of the market’s reversal of fortunes. Just yesterday, AAPL showed off impressive relative strength. Today, the stock dropped 3.6% and in one day gave up all its incremental post earnings gain. I jumped on this as an opportunity to start accumulating call options for next week’s AAPL trade.
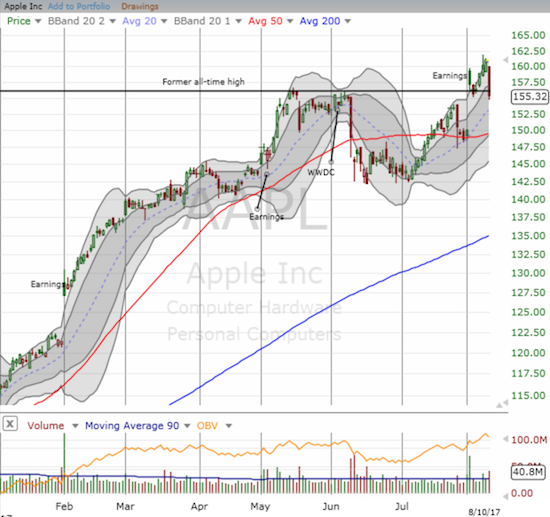
The day’s sell-off was severe enough to push Apple (AAPL) back below its previous all-time high.
In other trades I… sold my Alphabet (GOOG) put option, covered my Netflix (NFLX) short, added to my Facebook (FB) calls, and started right back into Twilio (TWLO) with a January 2018 call as the stock cratered 8.2% and filled its post-earnings gap. At least TWLO is still above its 200DMA for now.
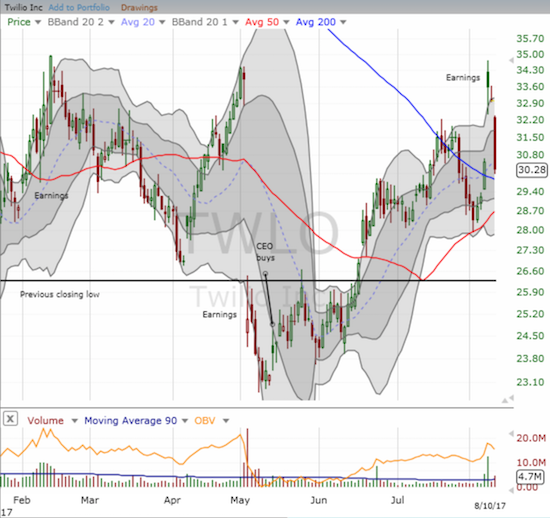
Twilio (TWLO) gave up all its post-earnings gains in just two days. Can its 200DMA save the day as support?
Chipotle Mexican Grill (CMG) was my big miss of the day. I failed to jump on put options as soon as the stock showed early signs of weakness. CMG closed the day with a 3.6% loss and a new 4+ year low.
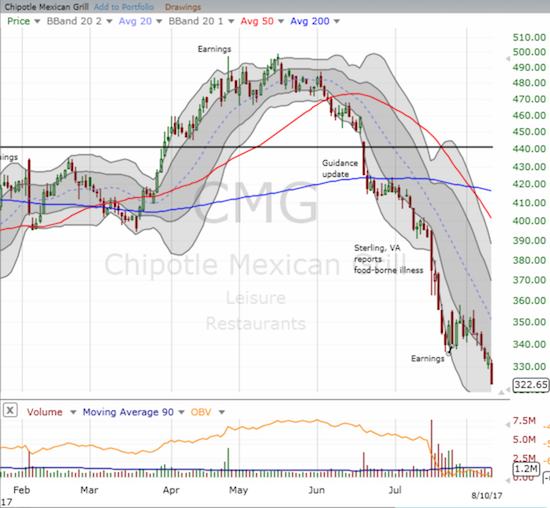
The selling in Chipotle Mexican Grill (CMG) has become relentless again.
This market juncture is tough to trade. The recent history of sellers with almost no follow-through encourages me to take profits quickly on bearish bets. Yet, with so many high-flying stocks in the market, selling follow-through can generate some significant gains on bearish trades. Losses on pre-existing bullish trades drag on the profits of the bearish trades gone well; yet, AT40 suggests that it is getting late to sell. Regardless, the window for this sell-off is likely very small, and the next key tell will be the behavior of the S&P 500, the Nasdaq, and QQQ when they bounce back for a test of their respective 50DMAs as resistance.
“Above the 40” uses the percentage of stocks trading above their respective 40-day moving averages (DMAs) to assess the technical health of the stock market and to identify extremes in market sentiment that are likely to reverse. Abbreviated as AT40, Above the 40 is an alternative label for “T2108” which was created by Worden. Learn more about T2108 on my T2108 Resource Page. AT200, or T2107, measures the percentage of stocks trading above their respective 200DMAs.
Active AT40 (T2108) periods: Day #375 over 20%, Day #189 over 30% (overperiod), Day #1 under 40% (underperiod ending 55 days over 40%), Day #6 under 50%, Day #12 under 60%, Day #135 under 70%
Daily AT40 (T2108)

Black line: AT40 (T2108) (% measured on the right)
Red line: Overbought threshold (70%); Blue line: Oversold threshold (20%)
Weekly AT40 (T2108)

Disclosure: Long SVXY calls, long FB calls, long GOOG call spread, long AMZN call spread, long NFLX calls, long AAPL calls, long TWLO call.
Follow Dr. Duru’s commentary on financial markets ...
more

