
Above The 40 – The Stock Market Stumbles Back To A Sharp Edge
AT40 = 49.0% of stocks are trading above their respective 40-day moving averages (DMAs)
AT200 = 50.1% of stocks are trading above their respective 200DMAs
VIX = 15.8
Short-term Trading Call: bullish
Commentary
Another proclamation on monetary policy from the Federal Reserve is just 3 trading days away. Hanging in the balance is the S&P 500 (SPY) as it precariously clings to support at its 50-day moving average (DMA). The Nasdaq and the PowerShares QQQ ETF (QQQ) are barely clinging to the bottom of their respective uptrend channels defined by their upper-Bollinger Bands (BBs).
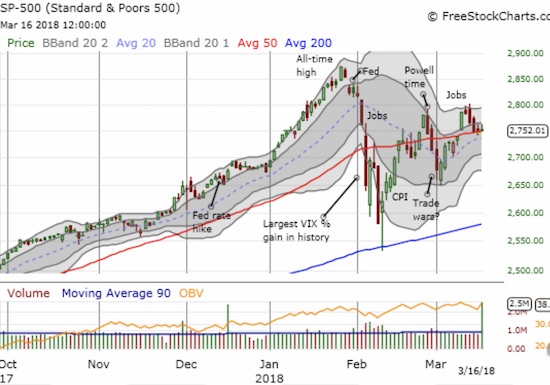
The S&P 500 (SPY) limps into this trading week after just barely avoiding a 5th day in a row of selling that closed the index on top of its 50DMA support for the 3rd day in a row.
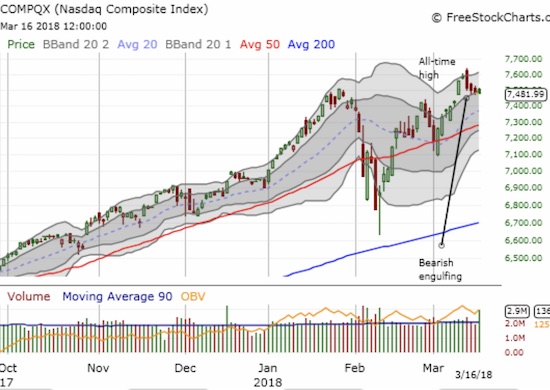
The Nasdaq started last week at a new all-time high and slid into Friday barely clinging to its short-term primary uptrend.
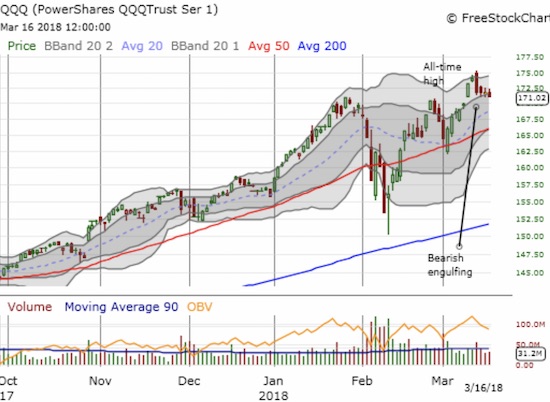
Like the Nasdaq, the PowerShares QQQ ETF (QQQ), spent most of the previous week cooling off from the last all-time high and barely clinging to the bottom of its upper-Bollinger Band channel.
With the iShares Russell 2000 ETF (IWM) gaining 0.5% on Friday, my favorite technical indicator, AT40 (T2108), the percentage of stocks trading above their respective 40DMAs, reversed most of its loss for the week. At 49%, AT40 is just under the 50.5% it achieved when the Nasdaq and QQQ made new all-time highs, and the S&P 500 broke out convincingly above its 50DMA resistance. At that time, I thought the stock market had returned to its “originally scheduled programming.” Instead, the channel switched right away.
Surprisingly, the volatility index, the VIX, is not reflecting an increase in anxiety even though the major indices performed poorly through most of the week. The 15.35 pivot acted as a powerful gravitational force. If the Federal Reserve works its calming magic this week, the VIX should even plunge below the pivot. I will be looking to add to my latest volatility fade on any increase in the VIX going into the Fed meeting.
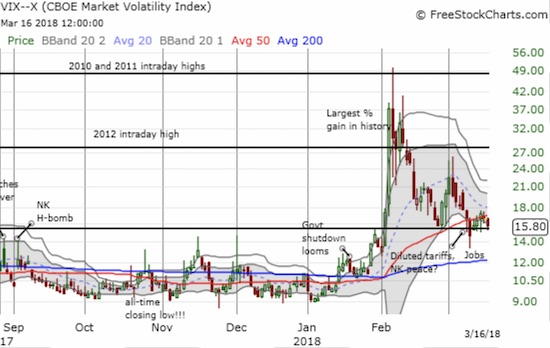
Something about that 15.35 pivot! The volatility index, the VIX, could not achieve escape velocity from the pivot even as sellers dominated the trading action for the week.
I kept my short-term trading call at bullish given the S&P 500 is clinging to 50DMA support and AT40 ended the week on a strong note. However, the Australian dollar (FXA) and the Japanese yen (FXY) continue to distract my confidence. I covered my short position on AUD/JPY into Friday’s selling (as well as a short on AUD/USD). At the time of writing, I re-established my short position as the currency pair continued its decline right to the edge of support formed by the April, 2017 intraday low. I assume a breakdown below this level has bearish implications for financial markets in general.
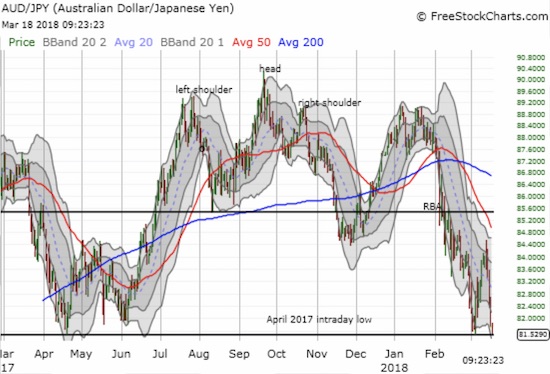
The Australian dollar versus the Japanese yen is challenging a major support level. AUD/JPY continues to flag warning signs for financial markets.
CHART REVIEWS
Logitech (LOGI)
LOGI is one of those stocks I never should have sold. Last year, LOGI briefly made a new all-time high that beat out the former all-time high set in 2007. The stock finally made a new all-time high after its January earnings report. That gap up closed with the February sell-off. I wish I noticed the pullback then. I DID take note of the latest pullback that has found support the entire month of March at a steeply rising 50DMA. I bought shares on Friday and plan to accumulate down to 200DMA support if the market offers up the discount.
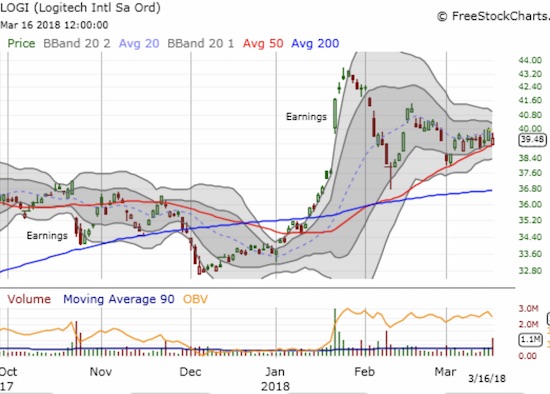
Logitech (LOGI) formed a triangle with its post-earnings pullback and solid support at its rising 50DMA. A breakout above $41.50, the previous peak, would be very bullish.
McDonalds Corp (MCD)
MCD was an example of a call gone right and a trade gone wrong. Two weeks ago, I sat astounded at the plunge in MCD and was eager to load up the truck with the stock. I wanted to stay patient, but the very next day the stock ran up on strong buying volume. Despite the strong showing, I anticipated a slow and churning recovery. So I bought a calendar spread at the $155 strike with the short side expiring March 16th and the long side expiring on April 20th. I targeted $155 as the top of the gap down. I figured MCD would be lucky to close the gap in two weeks. Investors had other ideas: MCD simply kept marching higher every single day until on Friday it reached 200DMA resistance. It was an incredible leap. I decided to close out the entire position at a small loss. I basically got too cute with my bullishness on the stock!
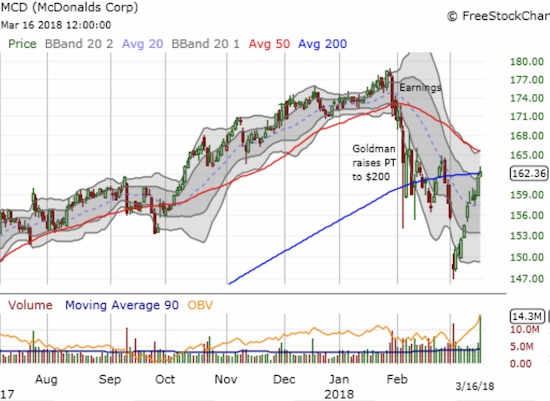
After suffering a beating for almost a month, MCD regained its strength in a big way. In two weeks, the stock gained 9.5% nearly straight up….
Other trades related to previous posts past 2 trading days: DKS shares called away, bought QCOM shares and calls, bought LOGI shares, bought X calls, bought M calls. expired worthless: QQQ calls, DPZ calls and puts!, TOL calls, TLT calls, SNAP covered call
“Above the 40” uses the percentage of stocks trading above their respective 40-day moving averages (DMAs) to assess the technical health of the stock market and to identify extremes in market sentiment that are likely to reverse. Abbreviated as AT40, Above the 40 is an alternative label for “T2108” which was created by Worden. Learn more about T2108 on my T2108 Resource Page. AT200, or T2107, measures the percentage of stocks trading above their respective 200DMAs.
Active AT40 (T2108) periods: Day #21 over 20%, Day #10 over 30%, Day #6 over 40% (overperiod), Day #4 under 50%, Day #29 under 60%, Day #35 under 70%
Daily AT40 (T2108)

Black line: AT40 (T2108) (% measured on the right)
Red line: Overbought threshold (70%); Blue line: Oversold threshold (20%)
Weekly AT40 (T2108)

Disclosure: Long SPY, long LOGI, short VXX.
Follow Dr. Duru’s commentary on financial markets via more


