
Above The 40 – The Stock Market Sharply Switches To A Bullish Divergence
AT40 = 47.9% of stocks are trading above their respective 40-day moving averages (DMAs)
AT200 = 54.6% of stocks are trading above their respective 200DMAs
VIX = 11.4
Short-term Trading Call: cautiously bullish
Commentary
The S&P 500 (SPY) failed to follow-through on Thursday’s snapback rally, but a bullish divergence kept the short-term prospects looking good. While the index gapped down and fell fractionally, AT40 (T2108), the percentage of stocks trading above their 40-day moving averages (DMAs) rallied into a positive close. My favorite technical indicator gained two percentage points to close at 47.9%.
In a surprising plot twist, small caps led the way as the iShares Russell 2000 ETF (IWM) bounced off its 50DMA to close with a fractional gain. Until the last two days, small caps were helping to underline the drag on the market that earlier represented narrowing participation in the stock market’s rally and formed a bearish divergence.
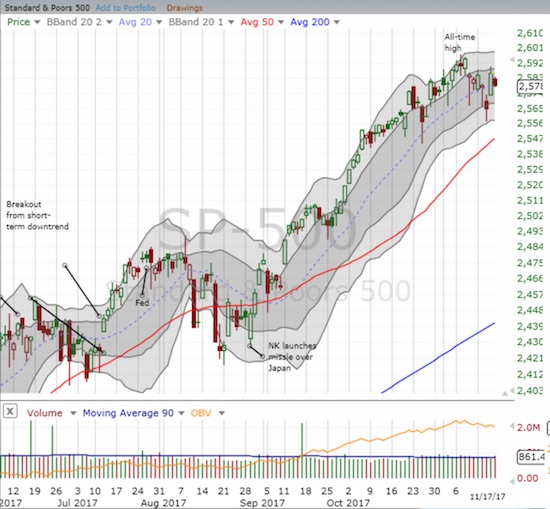
The S&P 500 cooled off a bit after a strong snapback rally. The index conveniently closed on its still uptrending 20DMA.
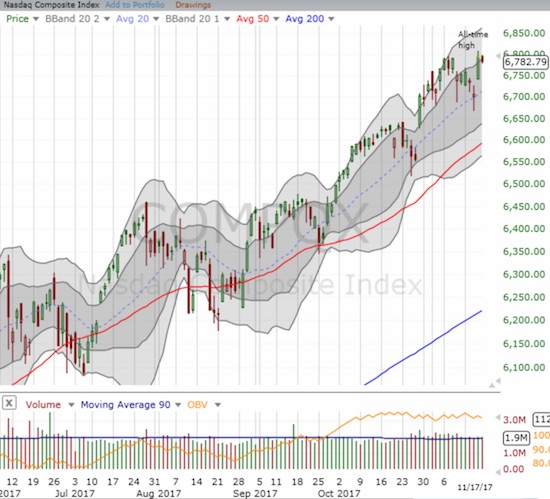
The Nasdaq fell from a marginal all-time high and is trying to cling to its re-entry into its upper-Bollinger Band (BB) channel.
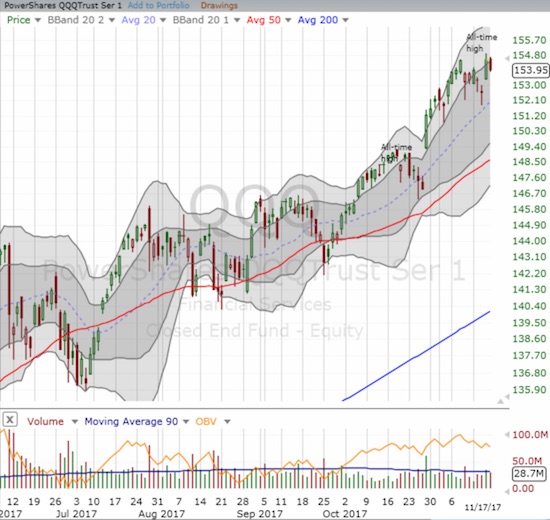
The PowerShares QQQ ETF (QQQ) also feel from its new marginal all-time high but did not hold its upper-BB channel.
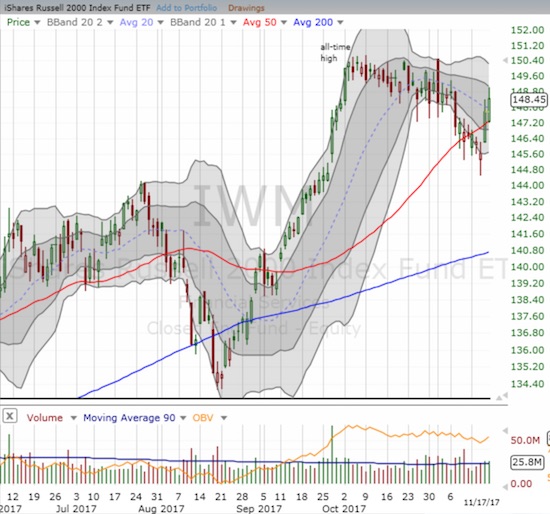
Suddenly, iShares Russell 2000 ETF looks ready to resume its previous rally. I am watching for the downtrending 20DMA to flatten.
The volatility index, the VIX, continued its fade from Wednesday’s spike higher. It is a move that confirmed the bullish divergence.
The Australian dollar however is still not cooperating. Its weakness continued. Against the Japanese yen, AUD/JPY confirmed a double breakdown: the 200DMA gave way as support AND the head and shoulders pattern completed its bearish warning.
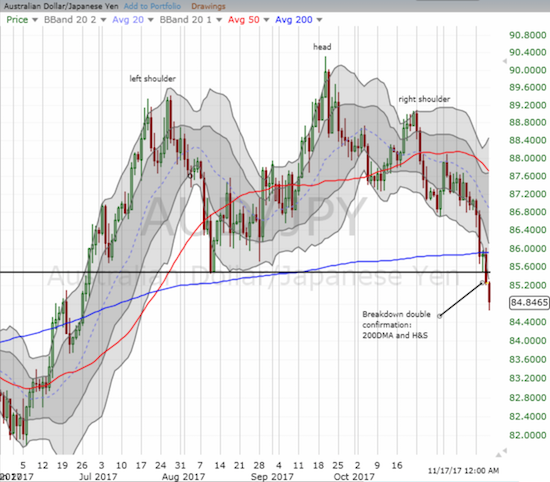
AUD/JPY followed through on a bearish breakdown.
Time is ticking away for the bears and sellers as the period between Thanksgiving and Christmas is typically a very mild, even bullish, period for the stock market.
STOCK CHART REVIEWS
Chipotle Mexican Grill (CMG)
CMG is looking more bullish again. This past week the stock managed to close at a post-earnings high (above the intraday high from the first day of post-earnings trading). This milestone is an early marker of recovery. Of particular interest is the big “swoosh” downward that started the week at a fresh 5-year intraday low. That low did not last long as buyers swooped in with enough force to close the stock with a gain on the day and continued creeping higher most of the rest of the week. Perhaps traders and/or market makers took out a bunch of stops and other similar motivated sellers. Resistance from the downtrending 50DMA still looms overhead.
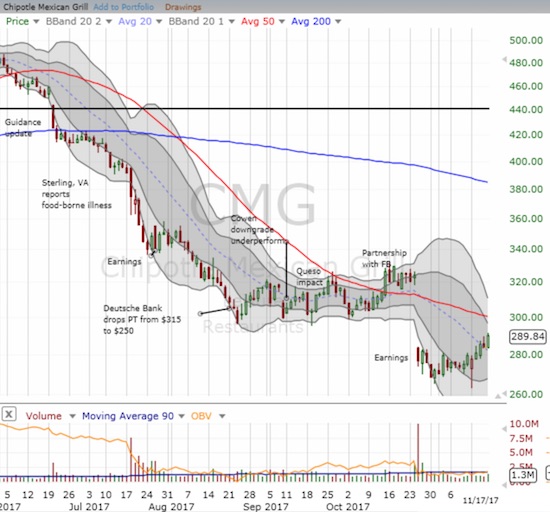
Chipotle Mexican Grill likely printed a more sustainable bottom this week.
Tesla (TSLA)
At Friday’s open, TSLA completed a post-earnings recovery on news of a semi truck and new roadster. However, sellers faded the stock from there and even managed to close the stock below its 200DMA. The recovery is thus not confirmed. Buyers will need to close the stock above Friday’s intraday high to regain the advantage.
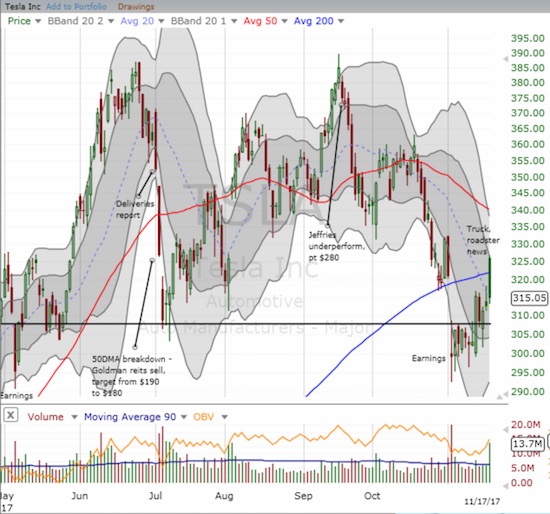
Tesla made a brief statement with a post-earnings recovery this week. Faders left the job incomplete as the stock closed below 200DMA resistance.
SPDR S&P Retail ETF (XRT)
I think retail could shape up to be a major recovery story for 2018. There was some surprising and impactful retail earnings news on Friday. XRT summarizes the net effect. I will just have to summarize the action with XRT. The retail-focused ETF gapped up above its downward trending 50 and 200DMAs. XRT ended the day with an impressive 2.8% gain. Three other breakouts this year failed miserably. Could the fourth time be a charm?
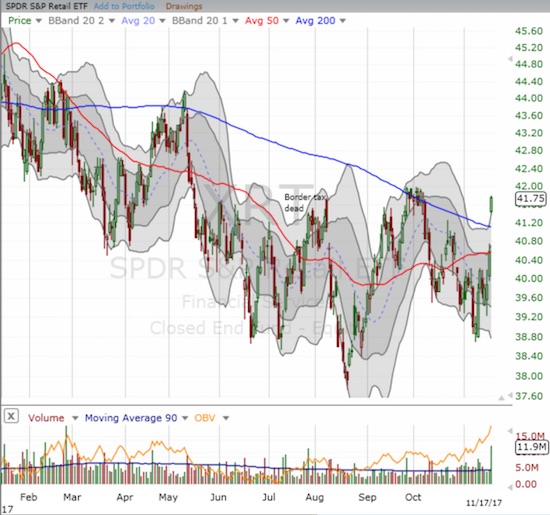
Did the SPDR S&P Retail ETF make a sustainable bottom in August? A higher high (above the Sept/Oct peak) would confirm the bottom.
Footlocker (FL)
FL seemed to lead the retail charge for the day, but I am not confident in the durability of the excitement over earnings. While FL beat revenue and earnings expectations, it guided down for Q4 earnings. The same-store comparable sales guidance was apparently slightly “less bad” than expected. I am guessing the announcement of layoffs got Wall Street excited (more money going to the bottom-line). Perhaps the partnership with Nike (NKE) called “Sneakeasy” sealed the deal on the excitement for the day:
“Experience sneaker culture like never before. Introducing Sneakeasy, a premium retail experience presented in partnership with Foot Locker, which offers a window to what’s next from Nike and Jordan. Open 11.22 -12.01 from 11am to 5pm at 30 Wall Street in New York.”
Talk about perfect product placement: analysts and bankers alike can walk down the street to feel the hype for themselves…
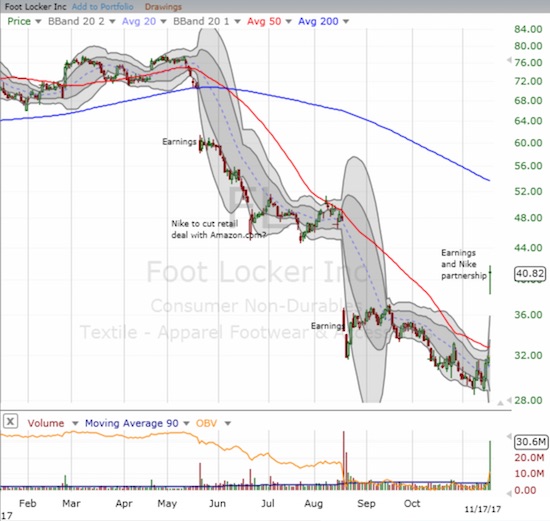
Footlocker soared 28.2% post-earnings. This was finally enough to make a dent into the gap DOWN from the last earnings report.
Hibbett Sports, Inc. (HIBB)
Hibbett Sports, Inc. (HIBB) provided a bit of rare good news for the sporting goods sector by guiding higher for fiscal year 2018. From the earnings report:
“Earnings per diluted share in the range of $1.42 to $1.50, which compares with previous guidance of $1.25 to $1.35. Comparable store sales in the negative mid-single-digit range, which compares with previous guidance in the negative mid to high single-digit range.”
In the third quarter, the company also repurchased 1.2M shares at a cost of $15.9M. This is a sliver compared to the $213.4M still left in the repurchase authorization. This meager activity tells me that HIBB is not yet very confident in its low valuation. In addition, HIBB still had to drop prices and sacrifice margins in the third quarter to move inventory:
“Gross margin was 32.0% of net sales for the 13-week period ended October 28, 2017, compared with 35.4% for the 13-week period ended October 29, 2016. The decrease was mainly due to promotions and markdowns taken to improve our inventory position. As a result, inventory turns improved significantly compared with the same period last year, and inventory levels declined 9.2%.”
HIBB gapped up, faded from its intraday high, and closed with a gain of 15.2%. HIBB is now up 82% from its 14-year intraday low set three months ago. It is still down 54% year-to-date.
Under Armour (UAA)
The earnings news was strong enough to carry over to stocks like Under Armour (UAA). I am much more interested in the possibilities here. My previous attempt to buy a bottom failed, and I was fortunate enough to stop out ahead of earnings. I like another buy here with a stop on a new all-time low.
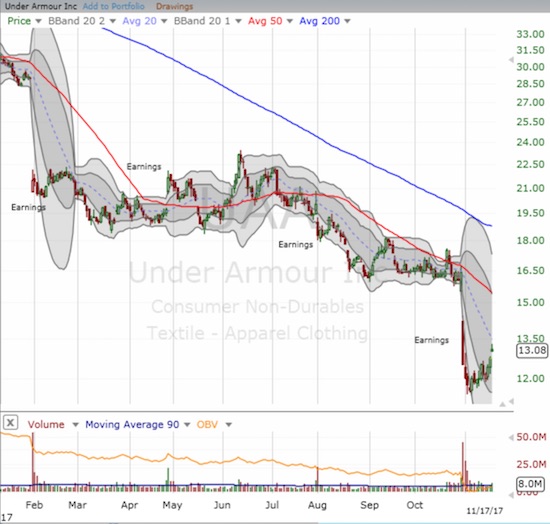
Buyers are trying to rally around the latest collapse in Under Armour. Friday’s gap up confirms the latest bottom for now.
Active AT40 (T2108) periods: Day #437 over 20%, Day #251 over 30%, Day #51 over 40% (overperiod), Day #7 under 50% (underperiod), Day #18 under 60%, Day #25 under 70%
Daily AT40 (T2108)

Black line: AT40 (T2108) (% measured on the right)
Red line: Overbought threshold (70%); Blue line: Oversold threshold (20%)
Weekly AT40 (T2108)

Disclosure: short AUD/JPY, long NKE.
Follow Dr. Duru’s commentary on financial markets via more


