
Above The 40 – The Stock Market Hits A New Bearish Divergence
AT40 = 39.9% of stocks are trading above their respective 40-day moving averages (DMAs)
AT200 = 58.3% of stocks are trading above their respective 200DMAs
VIX = 12.3 (volatility index)
Short-term Trading Call: neutral
Commentary
From a technical perspective, my last “Above the 40” post made as detailed a case as I can make to describe the erosion of the stock market’s foundations. Today, that erosion expressed itself in a new bearish divergence that I find remarkable. (The latest bearish divergence was invalidated by the S&P 500’s big mid-February breakout). The S&P 500 (SPY) bounced perfectly off support at its uptrending 20-day moving average (DMA) and closed with the slightest gain. Yet, AT40 (T2108), the percentage of stocks trading above their 40DMAs took a plunge to 39.9%. AT200 (T2107) took a dive to 58.3%.
(Click on image to enlarge)
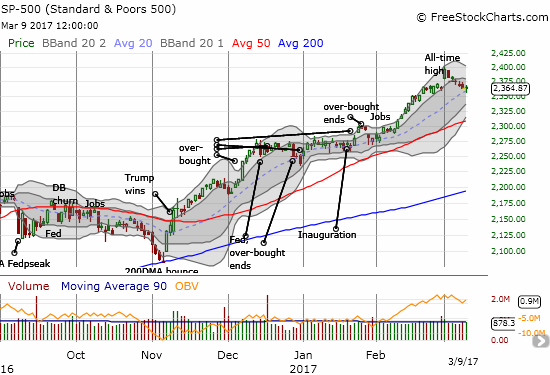
Sellers in the the S&P 500 (SPY) took their time again. This time, they failed to log a negative close. The index even looks poised for a bounce off 20DMA support.
(Click on image to enlarge)
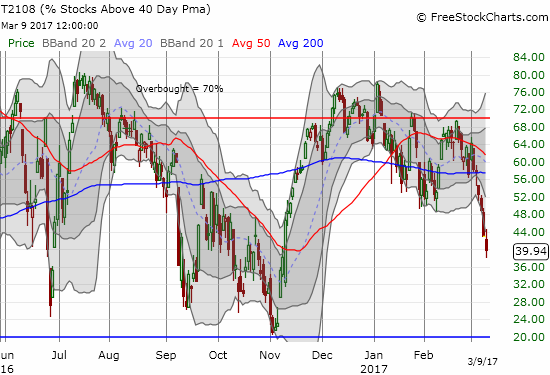
AT40 (T2108) plunged to close below 40% for the first time in 83 trading days.
(Click on image to enlarge)
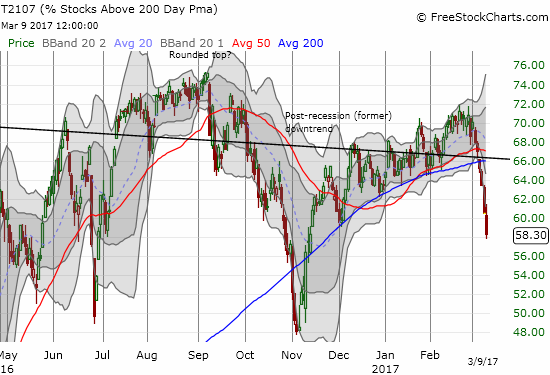
AT200 (T2107) once again confirmed the reversing momentum with an exclamation point.
The current pullback in the S&P 500 continues to look orderly and subdued. The index crossed my line into bearish territory but bounced above it into the close. So while the S&P 500 completed a reversal of its last bullish breakout, I still cannot flip my trading call to bearish.
While the S&P 500 drips ever so slowly, the descents in both AT40 and AT200 appear breathtaking. At its low of the day, AT40 finished reversing its ENTIRE post-election gain (coincidence AT40 bounced perfectly off its close from November 8, 2016?). At 39.9%, AT40 is officially within “striking distance” of oversold conditions. AT200 last closed as low as 58.3% on November 10, 2016. If the S&P 500 were to pullback even by a few percentage points over a few days, I am pretty sure I will be talking about the prospects for oversold conditions.
The volatility index, the VIX, increased to 12.3. The volatility products failed to move along with the VIX, so it never occurred to me to play an implosion of volatility, however brief, after tomorrow’s U.S. jobs numbers for February.
(Click on image to enlarge)
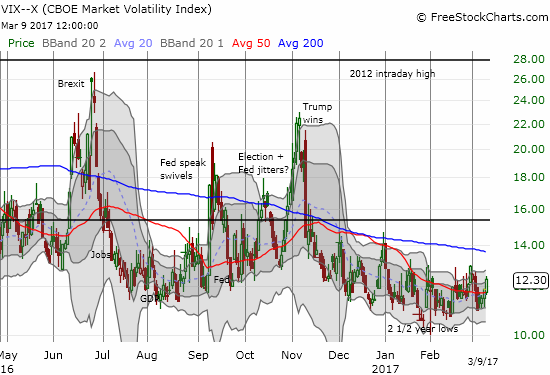
The volatility index, the VIX, finally looks like it is trying to carve out a bottom. The downward drift seemed to end when the VIX hit s new 2 1/2 year low last month.
On the day’s trading, I took a small profit on my call option on iShares Nasdaq Biotechnology (IBB). My Apple (AAPL) play is all but lost as the stock went absolutely nowhere this week. I am officially regretting taking off my gold versus bonds pairs trade as the iShares 20+ Year Treasury Bond (TLT) dropped back to a 20-month low matched in December. I locked in profits on my Direxion Daily Russia Bear 3X ETF (RUSS) shares as the ETF stretched above its upper-Bollinger Band (BB). From there I flipped into a call option on oil and gas play EOG Resources, Inc. (EOG) which bounced perfectly off 200DMA support. I am targeting overhead resistance at the 50DMA for taking profits.
(Click on image to enlarge)
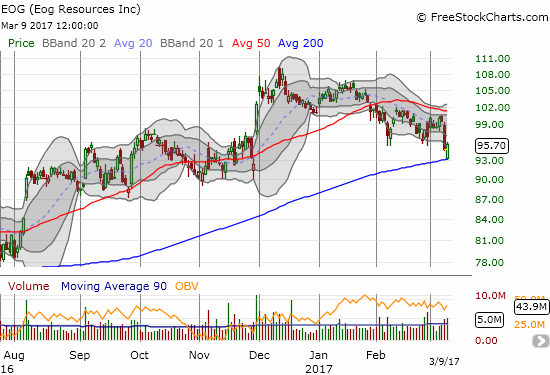
EOG Resources (EOG) comes storming back after tapping support at its 200DMA.
And then there is Snap, Inc. (SNAP) of course. For the first day in the stock’s young existence, I did not execute trade even as I was tempted to short at what I think is growing resistance just under $24. That price level was SNAP’s opening price; the low that first day of trading was $23.50. SNAP also had its smallest net daily move to-date as it closed with a mere 0.4% loss. Again, the 5-minute chart reveals best the dynamics of trading SNAP.
(Click on image to enlarge)
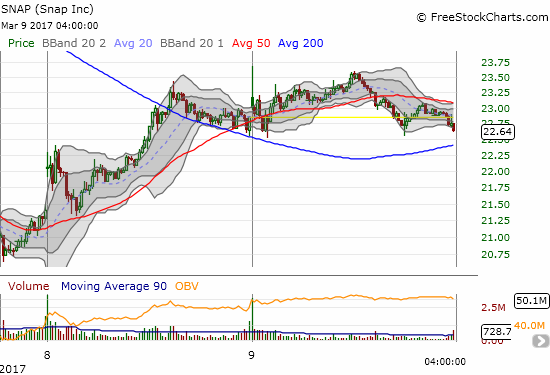
SNAP failed twice to break through resistance around $23.50
Another analyst released its opinion on SNAP, and another analyst avoided hyping up SNAP as is usually the practice following a hot IPO. FBN slapped a neutral rating and a $23 price target on SNAP. Yet, strangely enough, FBN also crowed about SNAP as a ripe acquisition target….at $14/share. From Barron’s:
“One of the key points that the bears on SNAP may be missing is that we believe that FB would love to acquire the company, and it could be willing to pay at least $20B+ ($14/share) for the asset. If this is so, then investors in SNAP effectively have a “put” at around $14/share. Remember that FB paid $21.8B for WhatsApp, a company which, although it had more users than SNAP, was not generating any real revenue. There are several reasons why FB might make a bid for SNAP at the right price: 1.) FB already tried to acquire SNAP (for ~$3B in 2013), and 2.) FB has the balance sheet and cash flow to finance such a deal, and 3.) Such a deal would remove one of the few long-term threats to its business.”
(Click on image to enlarge)
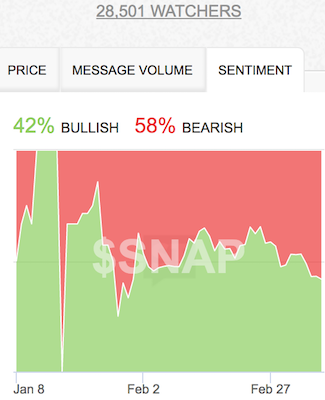
Source: StockTwits.com
SNAP sentiment fell to its lowest post post-IPO as bears crowd around.
“Above the 40” uses the percentage of stocks trading above their respective 40-day moving averages (DMAs) to assess the technical health of the stock market and to identify extremes in market sentiment that are likely to reverse. Abbreviated as AT40, Above the 40 is an alternative label for “T2108” which was created by Worden. Learn more about T2108 on my T2108 Resource Page. AT200, or T2107, measures the percentage of stocks trading above their respective 200DMAs.
Active AT40 (T2108) periods: Day #265 over 20%, Day #85 over 30% (overperiod), Day #1 under 40% (underperiod ending 83 days over 40%), Day #3 under 50%, Day #6 under 60%, Day #31 under 70%
Daily AT40 (T2108)
(Click on image to enlarge)

Black line: AT40 (T2108) (% measured on the right)
Red line: Overbought threshold (70%); Blue line: Oversold threshold (20%)
(Click on image to enlarge)
Weekly AT40 (T2108)

**All charts created using freestockcharts.com unless otherwise stated
Full disclosure: long UVXY call options, long SNAP, long QSR
Follow Dr. Duru’s commentary on financial markets via more


