
Above The 40 – The S&P 500 Wavers Its Way Into A Close Call
AT40 = 57.2% of stocks are trading above their respective 40-day moving averages (DMAs)
AT200 = 56.8% of stocks are trading above their respective 200DMAs
VIX = 11.2 (was as high as 13.2)
Short-term Trading Call: cautiously bullish
Commentary
It took three days for the volatility faders to show up again. Nerves in volatility trading stretched for a third day with the VIX trading as high as 13.2 and a 18.3% gain. The VIX ended the action with a fraction of a percent to call a gain.
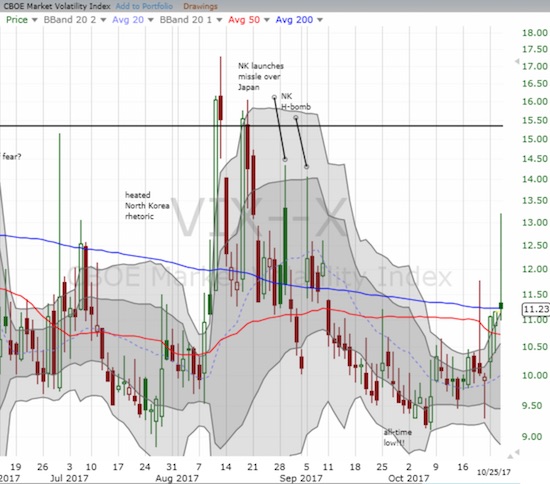
The volatility index, the VIX, has not traded three straight days to the upside since the first surge in August.
Always wary of the fleeting gains in going long volatility, I locked in a double on my call options on ProShares Ultra VIX Short-Term Futures (UVXY). While this gain on my latest tranche of UVXY calls was gratifying it ended a losing streak in place since September. The month was surprisingly placid and laid consistent waste to my once every two week UVXY hedges. It was a marked contrast to the small profits I eked out in August and the beginning of September.
The surge in volatility was large enough to flag a major sell-off. Yet, the S&P 500 barely lost 1% at its lowest point on the day. The index closed with a 0.5% loss. The recovery was important for my trading call. As I indicated in my last Above the 40 post, I planned to flip the short-term trading call all the way to cautiously bearish if the S&P 500 closed below last week’s low. As the chart below shows, the S&P 500 turned in a close call!
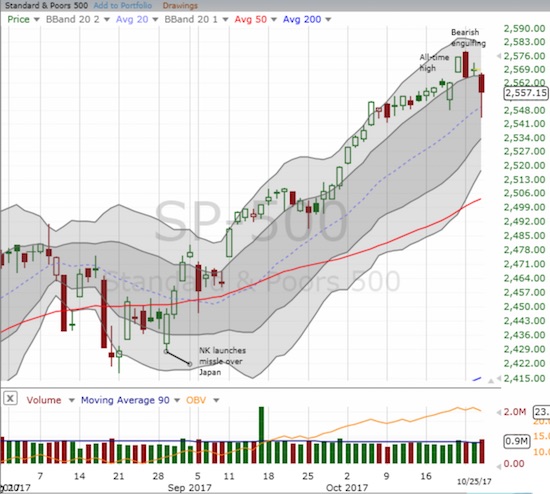
The S&P 500 (SPY) sliced through the previous week’s low before buyers rushed in to avoid a bearish breakdown.
Given the major fade of volatility, I am inclined to believe that sellers have exhausted themselves. However, the underlying weakness in the market remains. AT40 (T2108), the percentage of stocks trading above their respective 40-day moving averages (DMAs), dropped from 62.8% to 57.2%. This level is still far from oversold (20%) or “close enough” to oversold (low 30%s). The new bearish turning point is now a close for the S&P 500 below today’s intraday low (2,544). AT200 (T2107), the percentage of stocks trading above their respective 200-DMAs, dropped to a 1 month low.
I find it instructive to note how another bearish divergence resolved into a sell-off. It was shallow (again) but sharp enough to “feel” significant. This time around I changed my approach from trying to anticipate the timing of the imminent selling and instead prepared to buy in the wake of that selling.
The NASDAQ and the PowerShares QQQ ETF (QQQ) each tumbled similarly. The intraday recovery for QQQ was a bit more convincing.
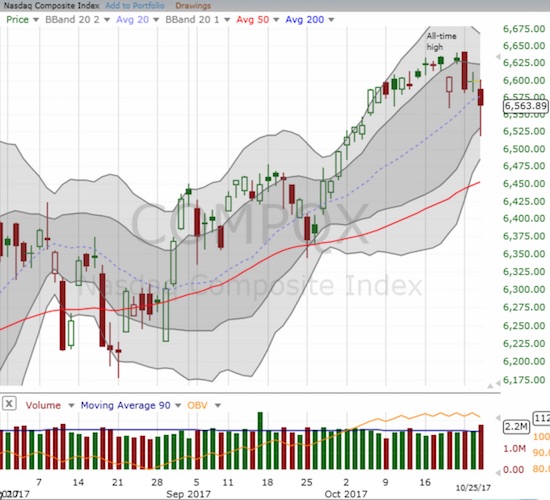
The NASDAQ recovered sharply off its low but still closed below its 20DMA uptrend.
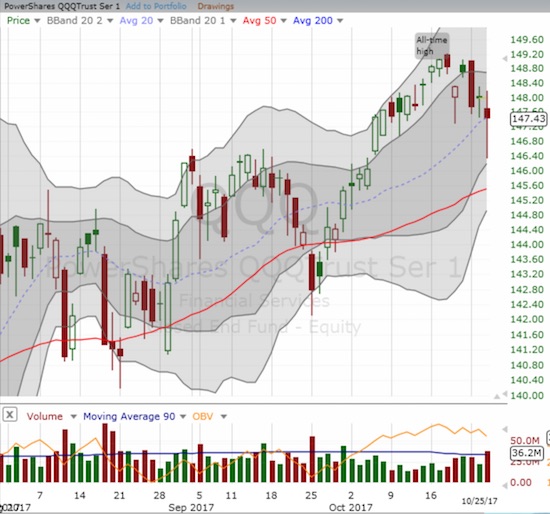
The PowerShares QQQ ETF (QQQ) recovered sharply to regain its 20DMA uptrend.
The selling was strong enough to push the Financial Select Sector SPDR ETF (XLF) into its own bearish engulfing topping pattern. I promptly closed out my XLF call options to preserve my remaining profits on the position.
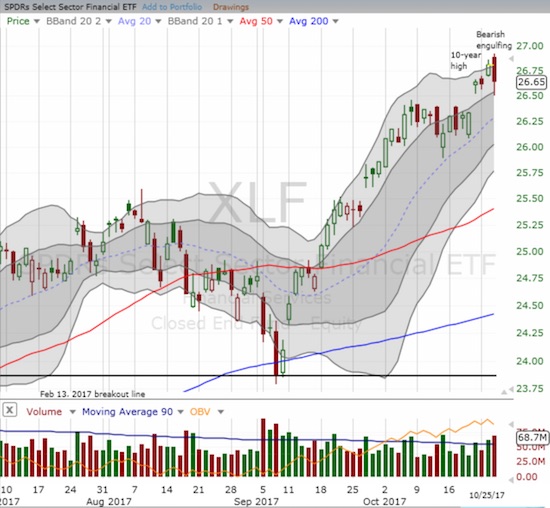
The Financial Select Sector SPDR ETF (XLF) printed its own topping pattern.
STOCK CHART REVIEWS
Chipotle Mexican Grill (CMG)
CMG was my biggest pain of the day. Earnings finally arrived, and the response was far uglier than I feared. I was hoping $300 established itself as a relatively strong support. Instead, it will likely now serve as resistance. I will once again stop out of a small position in shares. Per plan, I did not attempt a pre-earnings play with options (a simple put spread would have been quite profitable!).
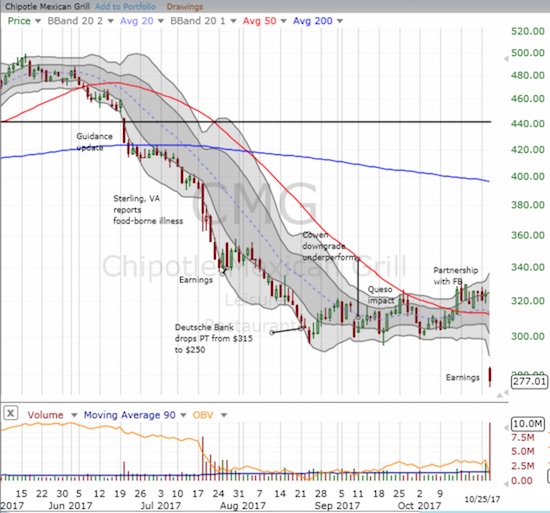
The bad news just keeps gushing out for Chipotle Mexican Grill (CMG). It closed with a 14.6% post-earnings loss.
International Business Machines (IBM)
Investors greeted IBM’s earnings last week with great cheer. It was enough to erase the loss from July’s earnings and challenge the April gap down all in one swoop. The shine came off big-time this week as IBM has suffered three days of sharp losses. Its bullish 200DMA breakout is over and now I wonder whether it will close its up gap to earn an award for relief rally of the year.
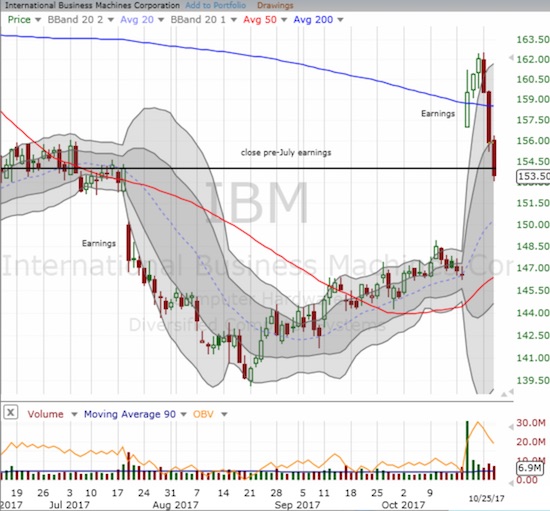
The tremendous relief in International Business Machines (IBM) is proving quite temporary.
Caterpillar (CAT)
The day’s selling was even strong enough to take CAT off its post-earnings perch. At its low of the day, I thought CAT was on its way to filling in its incredible up gap. The stock remains quite stretched as it sits on its upper-Bollinger Band (BB).
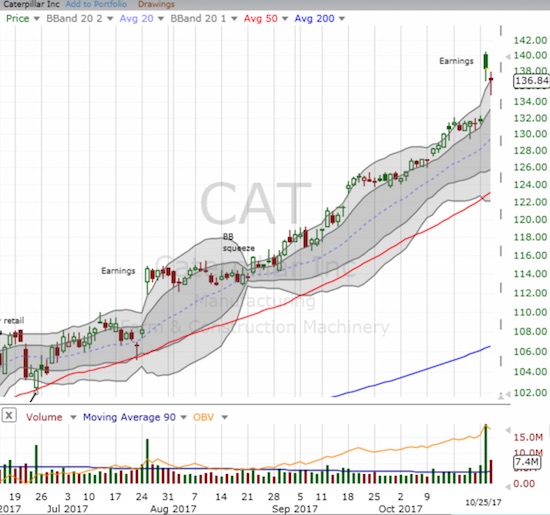
Can Caterpillar (CAT) hold onto its latest post-earnings celebration? The stock may be a buy near or at the lower edge of its upper-BB trading channel.
Whirlpool (WHR)
Despite continued momentum in housing stocks, WHR stumbled mightily post-earnings. A second day of post-earnings selling stretched the stock further below its lower-BB. This selling looks like it confirmed a top in WHR as the stock separates downward from a head and shoulders type of pattern (not shown in the chart below).
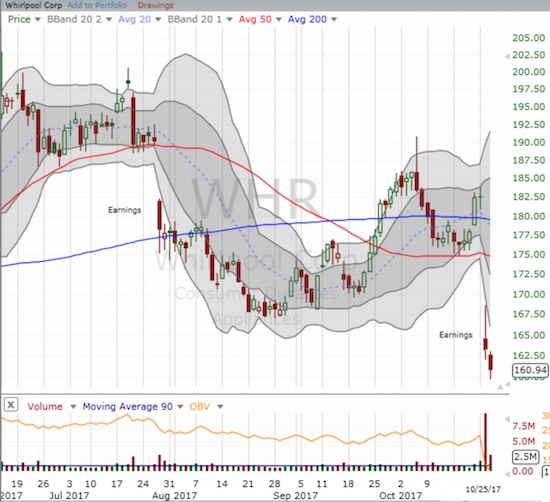
Whirlpool (WHR) trades in wild swings. The latest downward push my be the beginning of more selling to come as the stock prints a topping pattern on the double breakdown from 200 and 50DMA supports.
3M Company (MMM)
MMM defied the sellers and gravity as the stock pushed further beyond its upper-BB. The post-earnings surge and follow-through makes MMM a buy on the dip…whenever THAT happens!
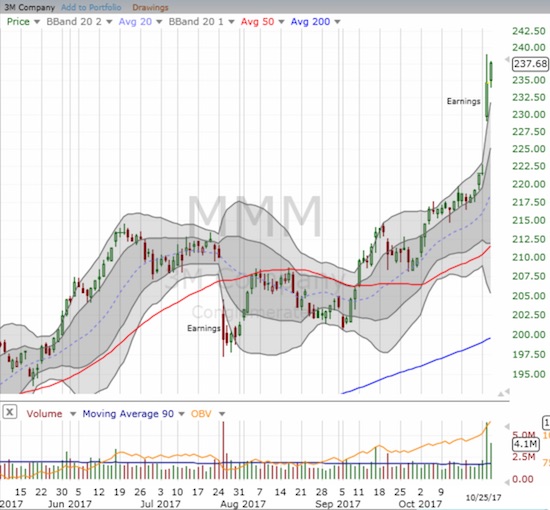
3M Company (MMM) now stands out as an old-line industrial stock that stubbornly resisted the wave of sellers and displayed great relative strength.
In other news, O’Reilly Auto Parts (ORLY ) got hammered in after-hours post-earnings trading. The 7% loss will no doubt take down peers and throw into question the nascent comeback for these stocks.
— – —
“Above the 40” uses the percentage of stocks trading above their respective 40-day moving averages (DMAs) to assess the technical health of the stock market and to identify extremes in market sentiment that are likely to reverse. Abbreviated as AT40, Above the 40 is an alternative label for “T2108” which was created by Worden. Learn more about T2108 on my T2108 Resource Page. AT200, or T2107, measures the percentage of stocks trading above their respective 200DMAs.
Active AT40 (T2108) periods: Day #420 over 20%, Day #234 over 30%, Day #34 over 40%, Day #33 over 50% (overperiod), Day #1 under 60% (underperiod ending 28 days above 60%), Day #8 under 70%
Daily AT40 (T2108)

Black line: AT40 (T2108) (% measured on the right)
Red line: Overbought threshold (70%); Blue line: Oversold threshold (20%)
Weekly AT40 (T2108)

*All charts created using freestockcharts.com unless otherwise stated
Be careful out there!
Full disclosure: long CMG shares, short CAT call spread
Follow Dr. Duru’s commentary on financial markets via more


