
Above The 40 – The S&P 500 Keeps Stretching Toward Overbought Status
AT40 Status: 67.3% of stocks are trading above their respective 40-day moving averages (DMAs)
AT200 Status: 70.8% of stocks are trading above their respective 200DMAs
VIX Status: 12.0 (volatility index)
Short-term Trading Call: neutral
Commentary
The S&P 500 (SPY) printed a positive gain for the 7th straight trading day and the 10th of the last 11. The index has achieved new all-time highs for 5 days in a row. Buyers are pressing in so eagerly that the S&P 500 is accelerating along its upper-Bollinger Band (BB). This picture looks quite bullish, but the price action is getting quite stretched.
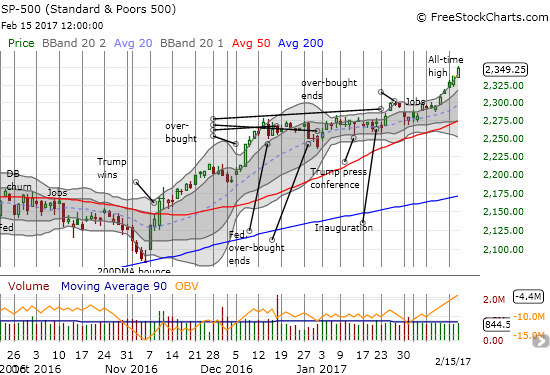
The S&P 500 ripped higher for a 0.5% gain and yet another all-time high.
The S&P 500 has still not stretched far enough to cross into overbought territory. Surprisingly, AT40 (T2108), the percentage of stocks trading above their respective 40-day moving averages (DMAs), barely responded today. AT40 increased by less than a point and was even down for part of the day. My favorite technical indicator continued to struggle to break into overbought territory even after ending the downtrend that locked AT40 into a bearish divergence from the S&P 500. AT200 (T2107), the percentage of stocks trading above their respective 200DMAs, did provide some confirmation of the bullish tones by closing at 70.8% and a new 4-month high.
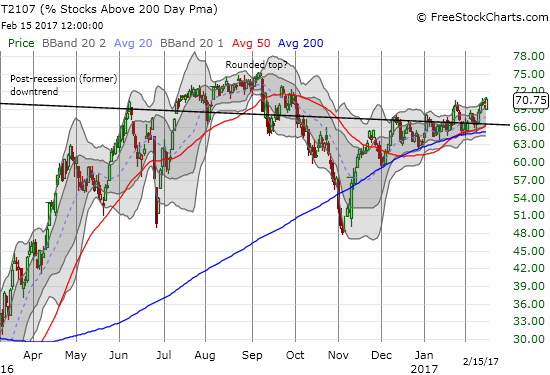
AT200 (T2107) is grinding higher and getting close to an important challenge of its last topping pattern.
Interestingly, the volatility index, the VIX, leapt by 11.5% to close at 12.0. While the VIX is still in a downtrend, this sudden pop despite the strong buying in the stock market was a handy reminder that the VIX tends to spend very little time below 11.
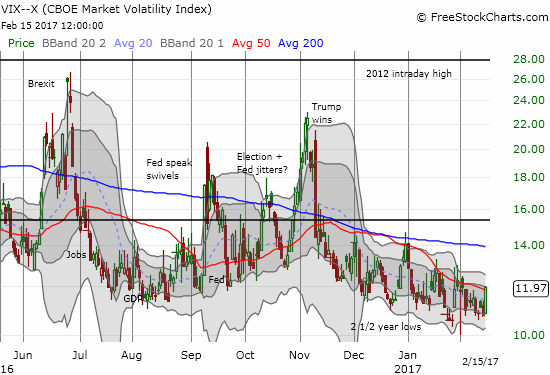
The volatility index, the VIX, rose sharply on the day despite the market’s on-going rally.
I have to assume that the contrast between the VIX and the S&P 500 today indicates big institutions are loading up on market protection when those options get extremely cheap.
The currency market is confirming the bullish tone of the market with the Australian dollar (FXA) continuing its rally over the Japanese yen (FXY). In fact, AUD/JPY rallied strongly off 50DMA support on the same day the S&P 500 began its current streak of all-time highs.
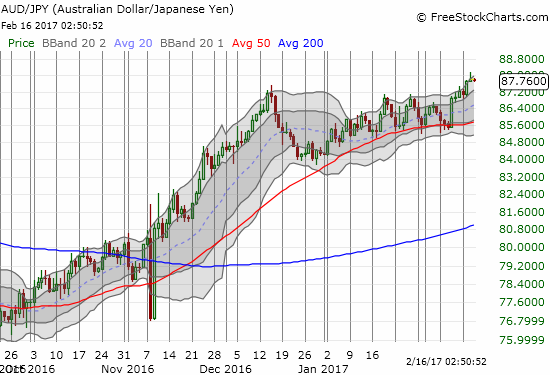
AUD/JPY hit a 13-month high after bouncing sharply off 50DMA support last week.
The market’s tide is lifting a lot of boats. My latest win was in Rapid7, IncRPD. (RPD), a stock I last reviewed two weeks ago. RPD soared in reaction to its last earnings report. RPD’s 12.7% gain broke the stock through resistance at its 200DMA. I took profits there. Buyers have managed to continue the push higher since then.
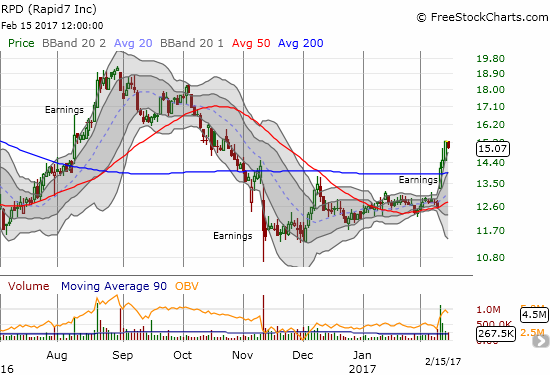
Rapid7, Inc. (RPD) broke out above 200DMA resistance and buyers bullishly followed through.
Tableau Software, Inc. (DATA) printed a potentially profitable post-earnings setup. DATA gapped up 14.7% higher after reporting earnings on February 2 but has yet to close higher. Between now and then, DATA consolidated until yesterday hitting the bottom of its upper-Bollinger Bands (BBs). Today, DATA increased 1.7% in a move that looks like a bullish breakout from the previous consolidation. The stop loss for a new position would be below the post-earnings low.
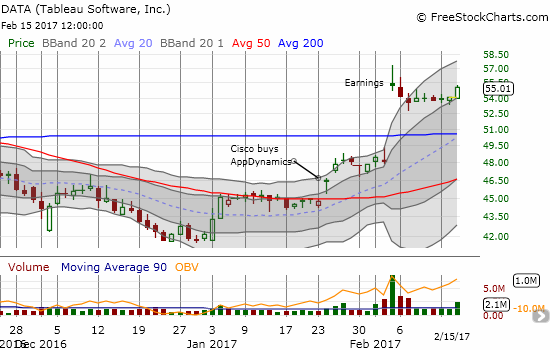
Tableau Software, Inc. (DATA) finally looks ready to resume its post-earnings momentum.
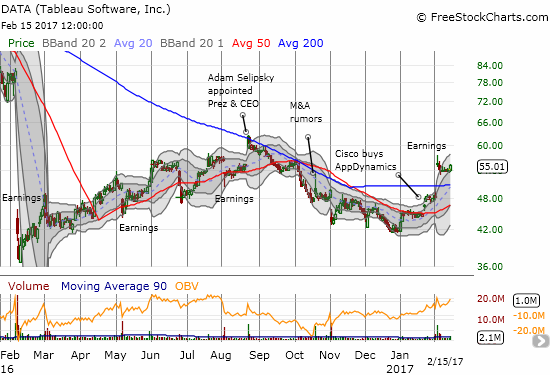
This zoomed out picture of DATA reminds us of the wild churn in this stock. DATA remains FAR from reversing its massive gap down from earnings a year ago.
Long-suffering Twitter (TWTR) investors got a sign of hope in the form of co-founder and CEO Jack Dorsey ponying up $7M to buy 426K shares of his company’s stock. Dorsey provided a vote of confidence in an environment where not even U.S. President Donald Trump’s frequent and newsworthy use of the platform can hold investor’s interest.
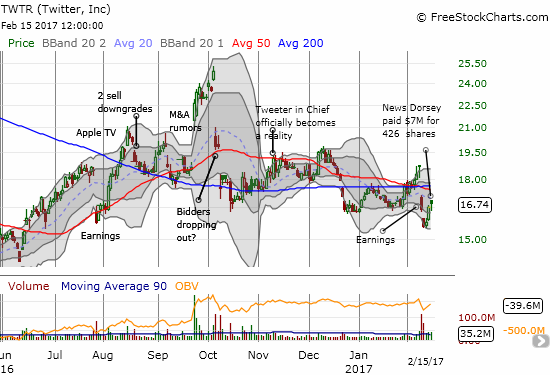
A Dorsey bottom for Twitter (TWTR)? The latest post-earnings low printed right below the post-earnings low from last summer.
“Above the 40” uses the percentage of stocks trading above their respective 40-day moving averages (DMAs) to assess the technical health of the stock market and to identify extremes in market sentiment that are likely to reverse. Abbreviated as AT40, Above the 40 is an alternative label for “T2108” which was created by Worden. Learn more about T2108 on my T2108 Resource Page. AT200, or T2107, measures the percentage of stocks trading above their respective 200DMAs.
Active AT40 (T2108) periods: Day #249 over 20%, Day #69 over 30%, Day #68 over 40%, Day #66 over 50%, Day #8 under 60% (overperiod), Day #15 under 70% (underperiod)
Daily AT40 (T2108)

Black line: AT40 (T2108) (% measured on the right)
Red line: Overbought threshold (70%); Blue line: Oversold threshold (20%)
Weekly AT40 (T2108)

*
All charts created using freestockcharts.com unless otherwise stated
The charts above are my LATEST updates independent of the date of this given AT40 post. For my latest AT40 post click here.
Be careful out there!
Full disclosure: long TWTR, short AUD/JPY (now a hedge)
more


