
Above The 40 – Overbought Conditions Abruptly End On A Reversal Day
AT40 = 64.0% of stocks are trading above their respective 40-day moving averages (DMAs) – ended a 1-day overbought period
AT200 = 62.7% of stocks are trading above their respective 200DMAs
VIX = 11.7
Short-term Trading Call: bullish
Commentary
It figures that just one day after the stock market finally crossed into overbought territory, it dropped right back out in dramatic fashion.
AT40 (T2108), the percentage of stocks trading above their respective 40-day moving averages (DMAs), dropped from 70.01% to 64.0%. Before the S&P 500 (SPY) closed with a loss it rallied to a new intraday high in what seemed like another powerful follow-through of bullish sentiment. Instead, the index lost 0.4%. Once again, I found little use for the mainstream financial press’s search for explanations; even the hand-wringing over what was apparently the largest one-day reversal in almost a year rang hollow to me. For example, the S&P 500 did not even close below the low of the previous trading day. The index bounced slightly off that point of support. Once that low gives out, THEN I will start wondering about whether the index can crack the threshold that flips me to bearish. Ditto on the Nasdaq and the PowerShares QQQ ETF (QQQ).
(Click on image to enlarge)
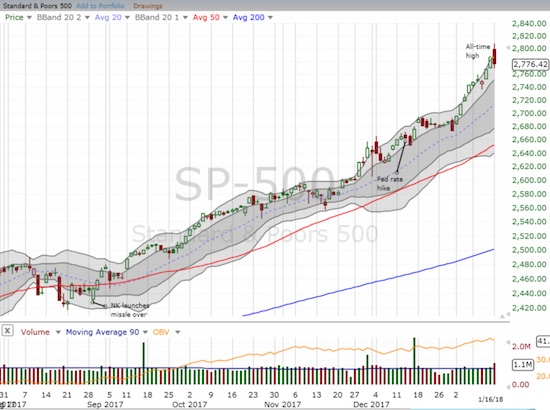
The S&P 500 (SPY) gapped higher from its all-time closing high but ended the day with a loss: a small gap and crap.
(Click on image to enlarge)
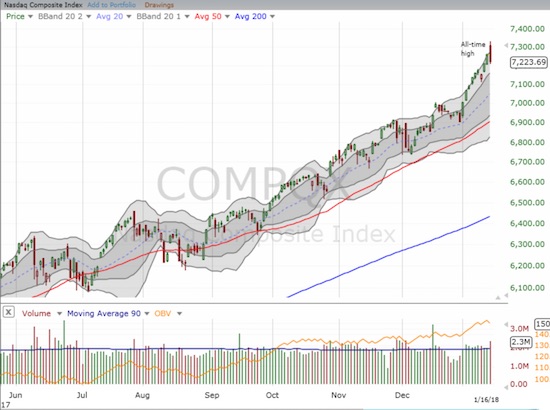
The Nasdaq followed right along with the S&P 500.
(Click on image to enlarge)
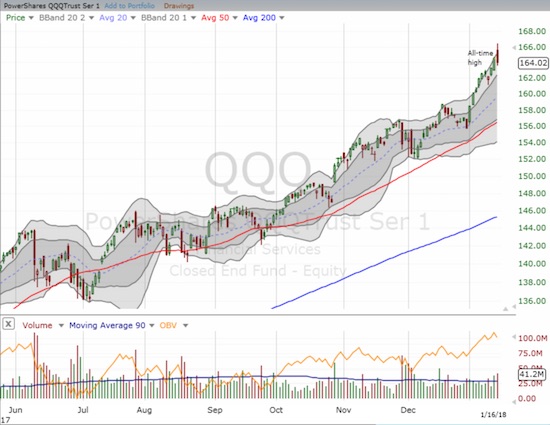
The PowerShares QQQ ETF (QQQ) followed right along with the Nasdaq but came far short of challenging the previous day’s intraday low or the close.
Small-caps suffered much greater damage. The iShares Russell 2000 ETF (IWM) closed below the low of the previous trading day and created a bearish engulfing pattern. The selling did not end until IWM tapped the bottom of its uptrending upper-Bollinger Band (BB) channel.
(Click on image to enlarge)
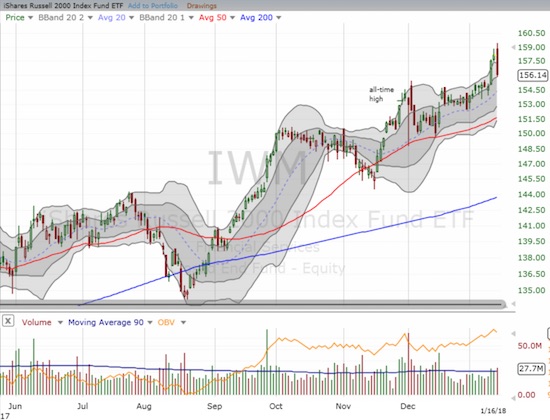
The iShares Russell 2000 ETF (IWM) tumbled from the top to the bottom of its uptrending upper-Bolling Band (BB) channel.
The U.S. dollar index (USD) also suffered a big move. The index extended a major breakout and finished the reversal of three years of gains. A bulk of the pounding is coming from the continuing resurgence of the euro. Last week, speculators increased net long contracts on the euro to levels not seen since at least 2008 – what I call “full bull.”
(Click on image to enlarge)
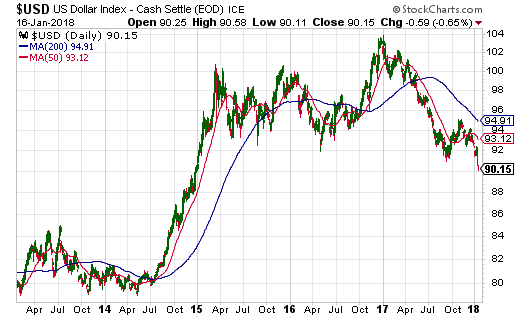
The U.S. dollar index (USD) broke down again and traded at its lowest point in the post-Trump era.
Source: StockCharts.com
(Click on image to enlarge)
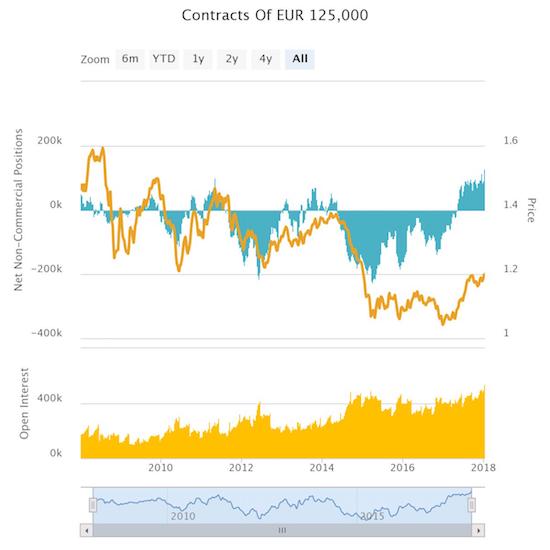
Speculators are getting ever more bullish on the euro with net long contracts at 10+ year highs.
In my last Above the 40 post, I noted how the volatility index, the VIX, looked like it was poised for a spike. Accordingly, I maintained a position in call options on ProShares Ultra VIX Short-Term Futures (UVXY). The VIX finally spiked and the typical volatility faders were not able to reverse all the day’s gains. I decided to hold onto my call options for at least one more day just in case the upward momentum is truly not finished quite yet.
(Click on image to enlarge)
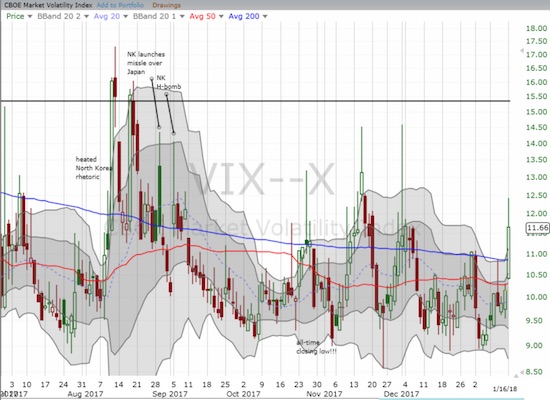
The volatility index, the VIX, gained 14.8% and a 1-month high.
STOCK CHART REVIEWS
SPDR Gold Shares (GLD)
GLD is benefiting from the dollar’s weakness. Speculators are also back on board with net long contracts increasing every week for the last 4 weeks. Positions are reaching back to where they were when GLD last peaked in early September, 2017.
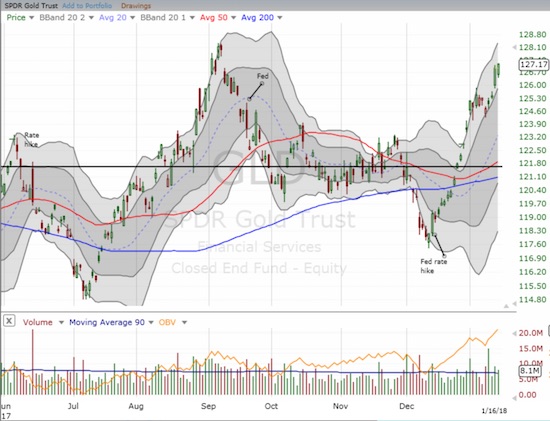
SPDR Gold Shares (GLD) continued its post-Fed rally. GLD is up 7.6% since the Fed HIKE interest rates.
(Click on image to enlarge)
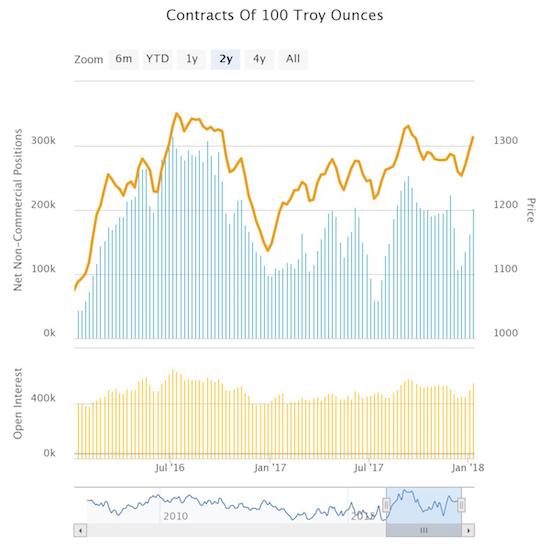
Speculators are once again ramping up net long positions in gold.


