
Above The 40 – Buyers Fail To Follow-Through As The S&P 500 Goes On Notice
AT40 = 52.8% of stocks are trading above their respective 40-day moving averages (DMAs)
AT200 = 56.3% of stocks are trading above their respective 200DMAs
VIX = 10.9 (volatility index)
Short-term Trading Call: cautiously bullish
Commentary
The Fed hikes short-term rates, and long-term rates go down. This relationship is not the expected one but is the consistent one. Last year, the iShares 20+ Year Treasury Bond (TLT) reached an all-time high after the Fed started its tightening cycle in December, 2015. Tuesday’s gap up confirmed TLT’s 200DMA breakout and could well be a fresh warm-up for a 2016-like run-up. It is time for me to get long again.
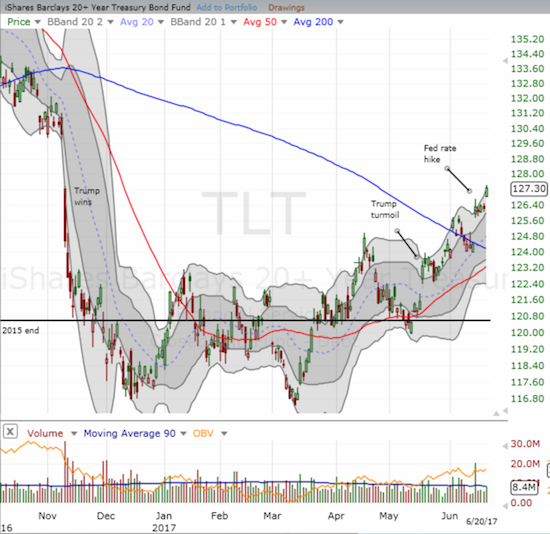
The iShares 20+ Year Treasury Bond (TLT) confirmed its 200DMA breakout and another Trump trade is on its way to a full reversal.
Of course, when TLT began its run-up in early 2016, it accompanied a steep plunge in the stock market as worries ran rampant that the bond ghouls were correctly anticipating some kind of economic calamity. While the underpinnings of the market still look good, I think it is wise to put the S&P 500 (SPY ) “on notice.”
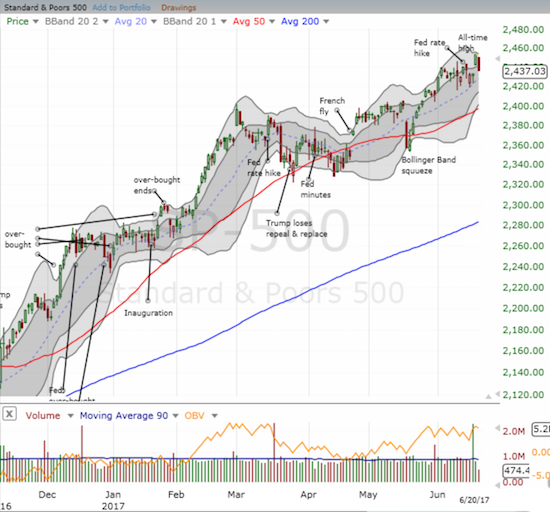
The S&P 500 (SPY) reversed by 0.7% and almost filled Monday’s gap up.
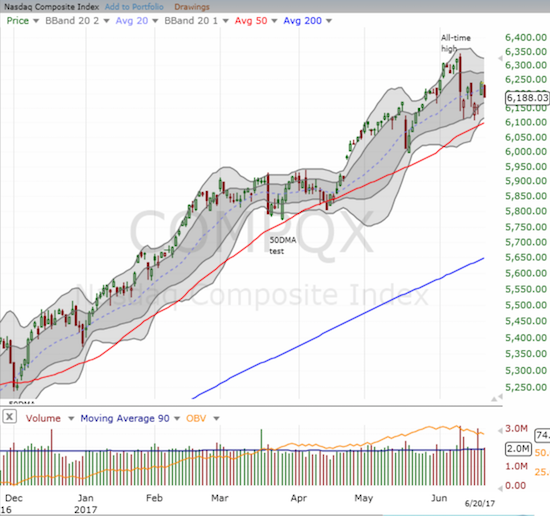
The NASDAQ – as well as the PowerShares QQQ ETF (QQQ) – reversed 0.8% and began a fill of Monday’s gap up.
During Monday’s rally I took profits up on a few long positions, including my Apple (AAPL ) call options. I decided to hold onto my QQQ call options. While I of course regretted that decision, I held the course and doubled down. Yet, with long-term rates tumbling and the Japanese yen (FXY) strengthening all over again (with a particular eye on a sell-off in AUD/JPY), I married that purchase with a double down on my call options on ProShares Ultra VIX Short-Term Futures (UVXY). I am basically banking on QQQ or UVXY soaring at least one more time this week.
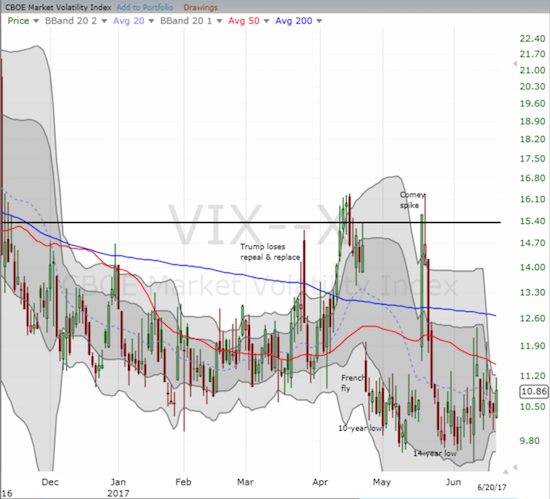
The volatility index jumped 4.7% but remains in extremely low territory.
AT40 (T2108), the percentage of stocks trading above their respective 40-day moving averages (DMAs), lost enough to go negative for the week and close at a near 2-week low. This pullback indicated some strong undertow in trading. Retail and energy were certainly two sectors whose broad-based losses likely contributed to the heaviness.
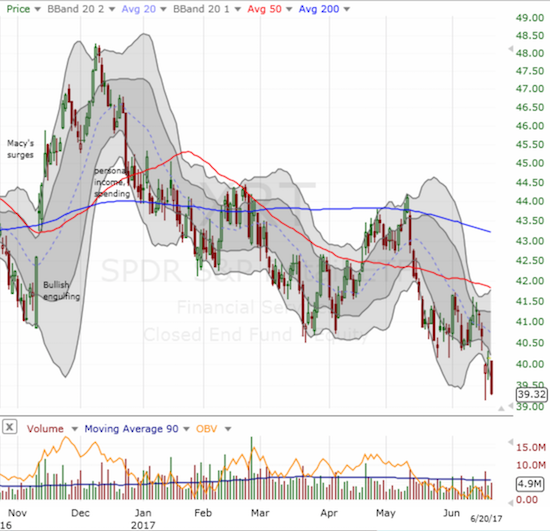
The SPDR S&P Retail ETF (XRT) hit a new 16-month closing low with a 2.0% loss on the day.
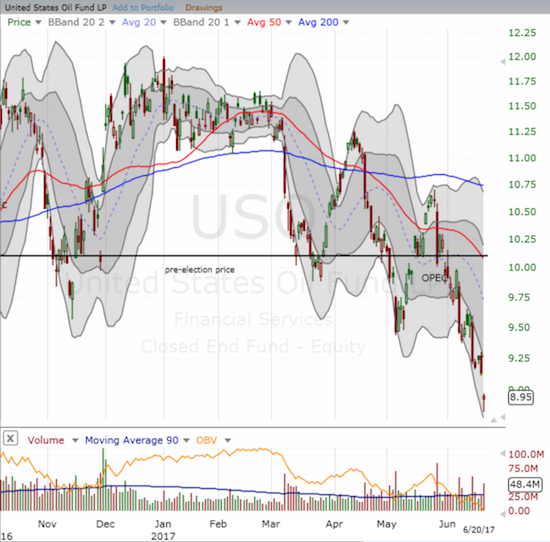
A new plunge in oil prices took United States Oil (USO) down to levels last seen in early 2016.
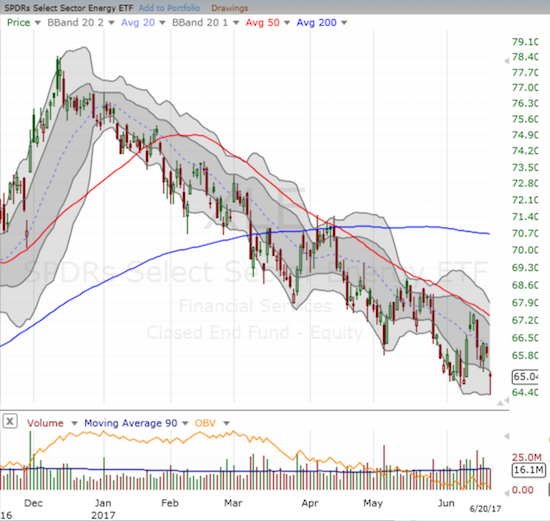
Buyers managed to pull the Energy Select Sector SPDR ETF (XLE) off its low and avoid a new 52-week low. Still, the downtrend for XLE remains well-defined and wickedly persistent.
With Tuesday’s loss. crude oil completed a 20% loss from its last high. This move technically pushed oil into a bear market. The last time crude oil cross this bearish threshold, it promptly rallied. I have my finger on the trigger in preparation for a relief rally.
Retail was hit by fresh headlines from Amazon.com (AMZN). The company’s plan to offer more innovations in the process of buying clothes spooked investors across the sector. Unlike Friday’s moves, AMZN’s giant sucking sound did produce gains although the stock did initially gap up.
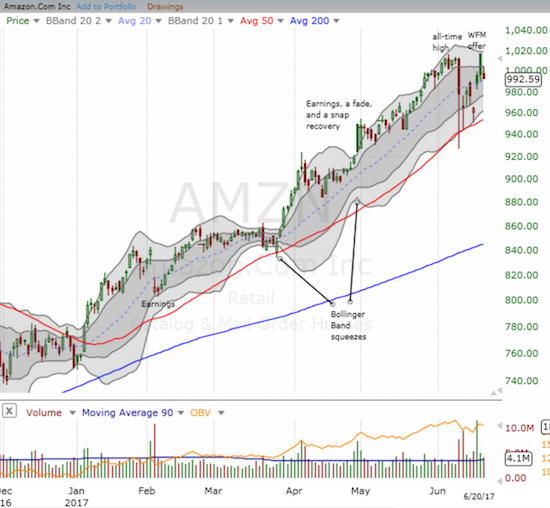
Suddenly, Amazon.com (AMZN) is having trouble hold the $1000 level.
If the market resumes its sprint this week, I expect AMZN to benefit. So I took advantage of this pullback to finally speculate on a call option.
In early May, I took fresh note of Chipotle Mexican Grill (CMG) as the market’s reaction to earnings seemed to confirm an on-going rally in the shares. Fast forward to today: CMG has confirmed a 50DMA breakdown with a severe gap down that finished a reversal of late March’s breakout and tested 200DMA support. The catalyst was an update on guidance that I would have interpreted as a small “tweak” if I had not seen the market’s severe reaction and CMG’s subsequent 7.3% loss. Although the entire market is likely staring at that 200DMA support line, I decided to trigger my “buy the dip” trade on CMG one more time with a short-term call option. Note that CMG is well over-extended below its lower-Bollinger Band (BB).
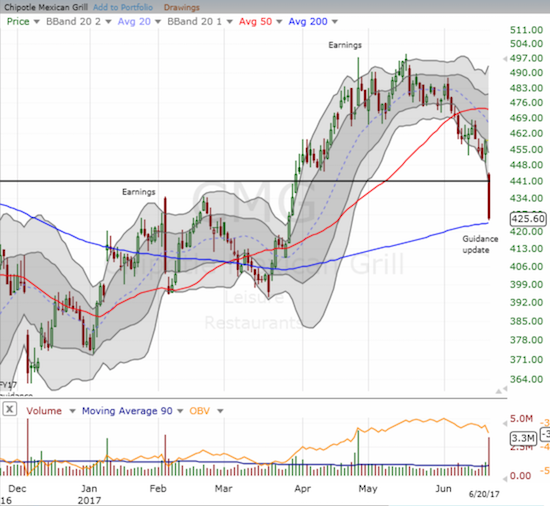
Chipotle Mexican Grill (CMG) is a 200DMA breakdown away from returning to bearish territory.
Finally, iShares MSCI Brazil Capped (EWZ) is back on my radar. The plunge in EWZ a month ago inspired me to trigger my buying rule for the ETF. EWZ’s sharp rally the following trading day contributed to what I called at the time the “Nut Job Stock Market.” EWZ lost 4.3% and looks ready to re-challenge the lows from May. With EWZ closing below its lower-BB, I am preparing to take another swing at the ETF.
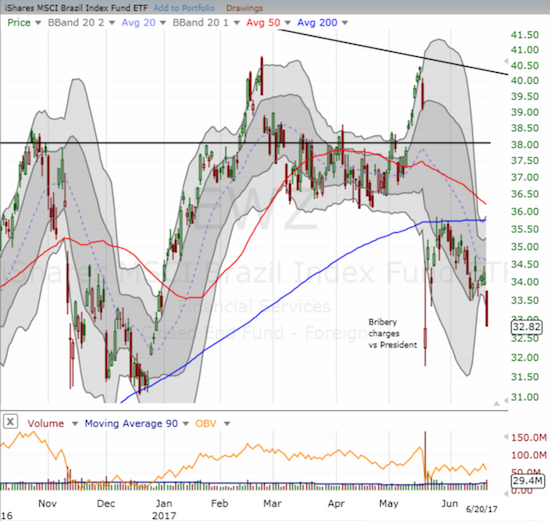
The iShares MSCI Brazil Capped (EWZ) has lost steam again. The ETF found picture-perfect resistance at its 200DMA.
— – —
“Above the 40” uses the percentage of stocks trading above their respective 40-day moving averages (DMAs) to assess the technical health of the stock market and to identify extremes in market sentiment that are likely to reverse. Abbreviated as AT40, Above the 40 is an alternative label for “T2108” which was created by Worden. Learn more about T2108 on my T2108 Resource Page. AT200, or T2107, measures the percentage of stocks trading above their respective 200DMAs.
Active AT40 (T2108) periods: Day #339 over 20%, Day #153 over 30%, Day #20 over 40%, Day #7 over 50% (overperiod), Day #2 under 60% (underperiod), Day #99 under 70% (corrected from June 9, 2017 post by doing complete recount!)
Daily AT40 (T2108)

Black line: AT40 (T2108) (% measured on the right)
Red line: Overbought threshold (70%); Blue line: Oversold threshold (20%)
Weekly AT40 (T2108)

*All charts created using freestockcharts.com unless otherwise stated
Be careful out there!
Full disclosure: long QQQ call options, short USO put options, long AMZN and XLE call options
*Charting notes: FreeStockCharts.com uses midnight U.S. Eastern time as the close for ...
more


thank