
Above The 40 – Bullish Divergence Powers Through A Wicked Rotation
AT40 = 59.8% of stocks are trading above their respective 40-day moving averages (DMAs)
AT200 = 59.1% of stocks are trading above their respective 200DMAs
VIX = 10.7
Short-term Trading Call: cautiously bullish
Commentary
“Time is ticking away for the bears and sellers as the period between Thanksgiving and Christmas is typically a very mild, even bullish, period for the stock market.”
This is what I said in the last Above the 40 post for November 17th when I described a bullish divergence that signaled more gains ahead. That bullish divergence did indeed resolve to the upside as the S&P 500 (SPY) made a new all-time high this week. However, a massive stock rotation today threw an intriguing twist in the unfolding bullish picture.
The S&P 500 closed the day, yesterday, essentially flat after bouncing from a small gain to a small loss. The Nasdaq lost 1.3%, and the PowerShares QQQ ETF (QQQ) took a 1.7% dive. The money that bled from big cap tech essentially rotated into small caps, retail, and financials. To a lesser extent, the energy and agricultural sectors also benefited from the rotation. Bio-techs could not hold onto earlier gains.
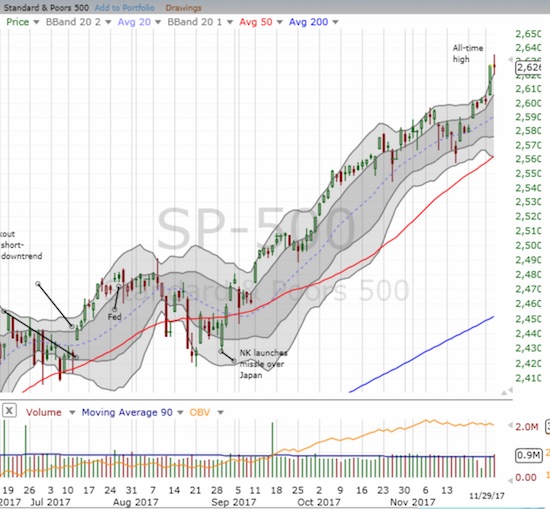
The S&P 500 (SPY) took a shallow breather from the previous day’s run-up and still closed above its upper-Bollinger Band (BB).
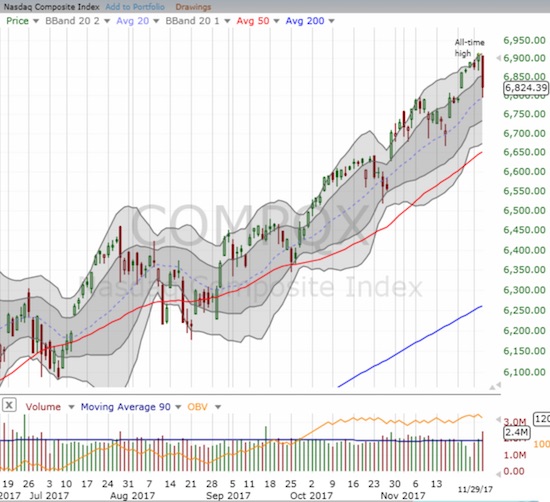
Selling on the Nasdaq only came to an end once the tech-laden index hit its uptrending 20DMA.
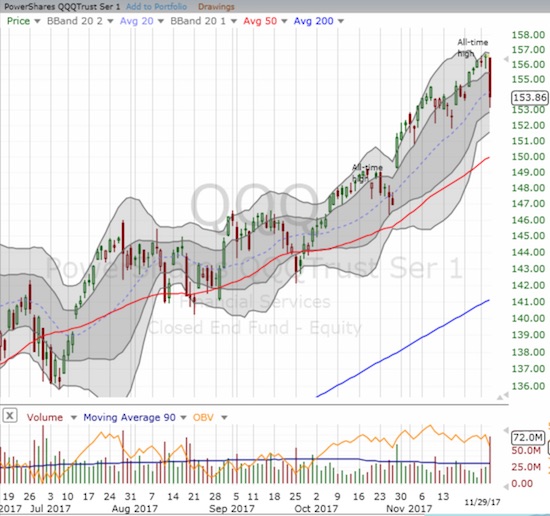
The PowerShares QQQ ETF (QQQ) sliced right through its uptrending 20DMA on the way to a 1.7% loss on the day.
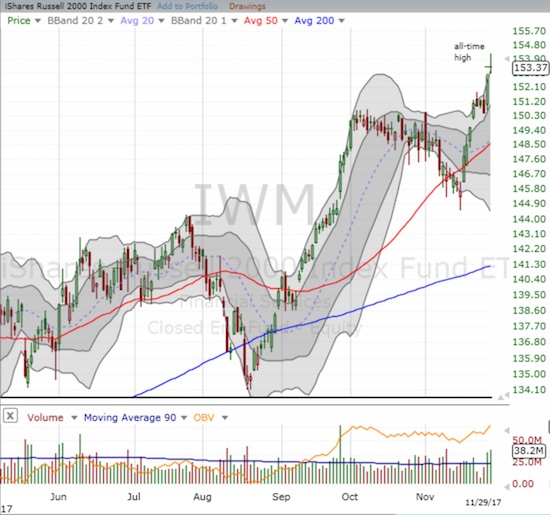
Small caps followed through on the previous day’s breakout. The iShares Russell 2000 ETF (IWM) ended the day with a 0.3% gain and another close above its upper-BB.
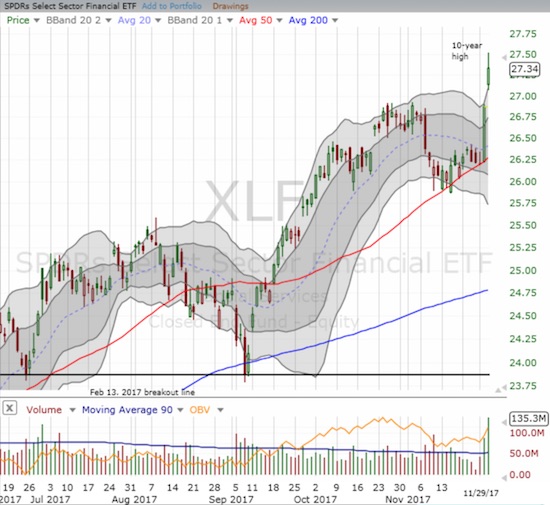
The Financial Select Sector SPDR ETF (XLF) broke out to a 1.7% gain on top of the previous day’s whopping 2.6% jump off 50DMA support.
So while the likes of Apple (AAPL), Alphabet (GOOG), Facebook (FB), Nvidia (NVDA), Netflix (NFLX), and Amazon (AMZN) experienced deep losses of 2.1%, 2.5%, 4.0%, 6.8%, 5.5%, and 2.7%, a large part of the market moved higher just fine.
AT40 (T2108), the percentage of stocks trading above their respective 40DMAs, confirmed the market’s overall bullish action by inching higher from 58.2% to 59.8%. Another test of overbought conditions (above 70%) is within sight. My trading call stays at cautiously bullish until I see the market’s behavior at or near overbought conditions. The caution now also makes sense given the steep losses in big cap tech. In particular, FB closed right at its 50DMA support and 50DMA support gave way decisively for NVDA and NFLX. The volatility index, the VIX, also managed a gain of 6.7%.
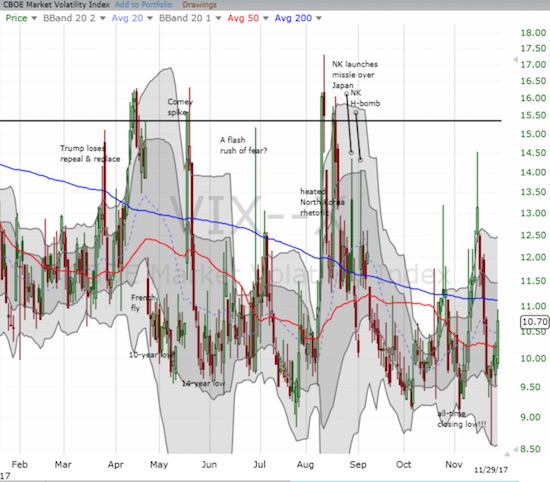
The volatility index, the VIX, jumped but is still at an extremely low level.
Although I wrote up a new plan for hedging using volatility, I decided to roll into one more set of call options on ProShares Ultra VIX Short-Term Futures (UVXY) expiring on December 22nd. While the current low levels are bullish indicators for the market, the VIX itself looks ready for another (brief) run-up. I will be quick to lock in any profits on this latest tranche of UVXY call options.
STOCK CHART REVIEWS
Chipotle Mexican Grill (CMG)
In my last Above the 40 post, I noted that CMG was looking more bullish with a more sustainable bottom. So I was on alert when CMG spurted higher the previous day. Yet I failed to get in a new position as I set a lowball offer on another tranche of call options. I was of course full of righteous regret when the stock gapped up on news of search for a new CEO. CMG closed the day with an impressive 5.6% gain and a fresh 50DMA breakout.
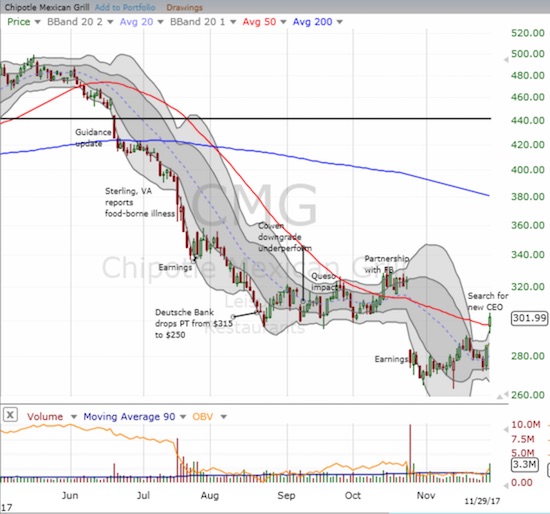
Chipotle Mexican Grill (CMG) punches through 50DMA resistance again. This move seems to confirm the bottoming process underway following another poor response to earnings.
The previous CEO tried his best to re-instill confidence in the Chipotle brand, but it was clearly insufficient. I expect CMG to come up with a heavy hitter replacement. Based on the big rally on the day, I suspect the market shares my opinion.
Tesla (TSLA)
TSLA’s post-earnings recovery remains unconfirmed. TSLA lost 3.2% by the close; the intraday low almost reversed the entire post-recovery gain. The chart below shows how TSLA is pivoting on a support line that separates the stock from a large topping pattern. Converging resistance from the declining 50DMA and the 200DMA will soon form TSLA’s next critical test.
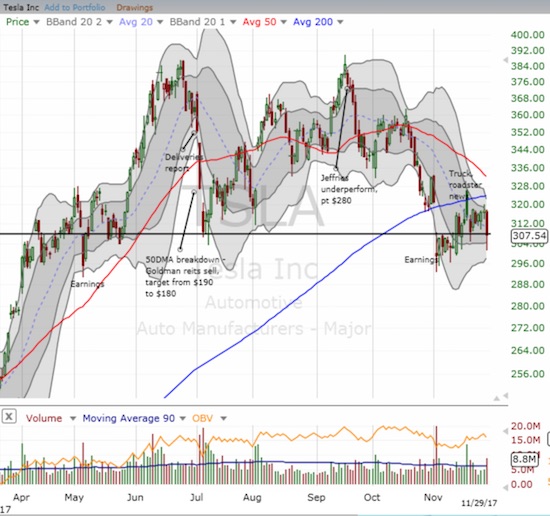
Tesla (TSLA) stares down a critical test between support at the bottom of a topping pattern and the overhead resistance its 20 and 50DMAs.
SPDR S&P Retail ETF (XRT)
In my last Above the 40 post, I claimed that retail could shape up to be a major recovery story for 2018. It looks like some investors may be trying to get a jump on that thesis. Today’s move forced my hand earlier than desired, and I bought the first intraday dip with a few January call options. I will continue accumulating on dips from here. After the January expiration, I will consider accumulating shares for a more extended run.
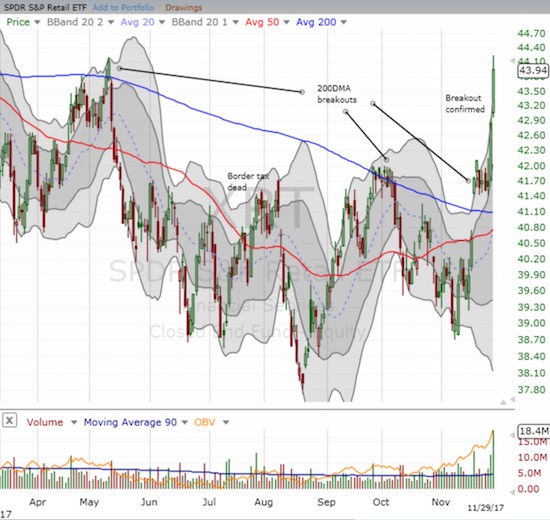
The SPDR S&P Retail ETF (XRT) gained 2.5% and finally confirmed a 200DMA breakout.
Target (TGT)
The rotation into retail stocks was very strong and broad-based. TGT was one of the strongest I saw on the day; I was biased of course because I already own it. Shortly after I wrote about its breakout, TGT started slipping. The stock even broke 200DMA support, but I remained stubborn. I thought I had more time to grow my position at lower prices…
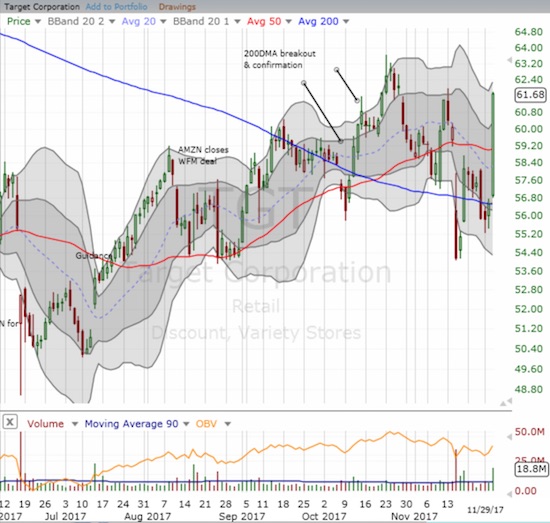
Target (TGT) gained a whopping 8.9% on its way to reconfirming the previous breakout(s).
O’reilly Automotive (ORLY)
I remain bullish on a recovery for the auto parts sector. Today, ORLY finally broke out above its 200DMA resistance. Given the stock traded well above its upper-Bollinger Band (BB), I was very tempted to take profits. Autozone (AZO) is looking even better with a distinct V-like rebound. I may have missed the window for a low risk purchase on AZO.
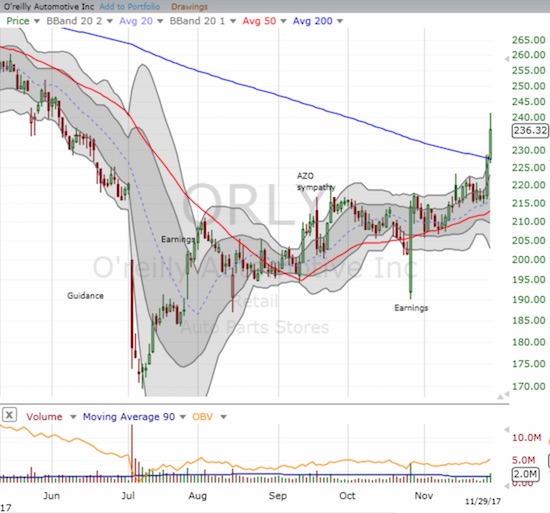
O’reilly Automotive (ORLY) continues a sharp recovery from the initial selling that followed earnings. A 3.4% gain declared a 200DMA breakout.
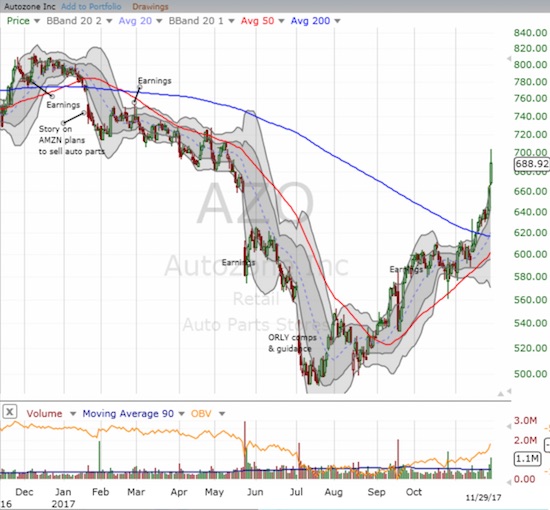
I panned out for the chart of Autozone (AZO) to put the 200DMA breakout in the context of one impressive V-like recovery from its lows.
Movado (MOV)
I take a special interest in stocks which manage to reverse sharp post-earnings moves. MOV surged as much as 16.7% post-earnings before settling on an 11.6% close. Unlike the last post-earnings gap up, MOV reversed its gains, and it took just two days. Given my bullish 2018 thesis on retail, I bought the dip. I particularly liked how parallel support at the 20 and 50DMAs seemed to hold firm.
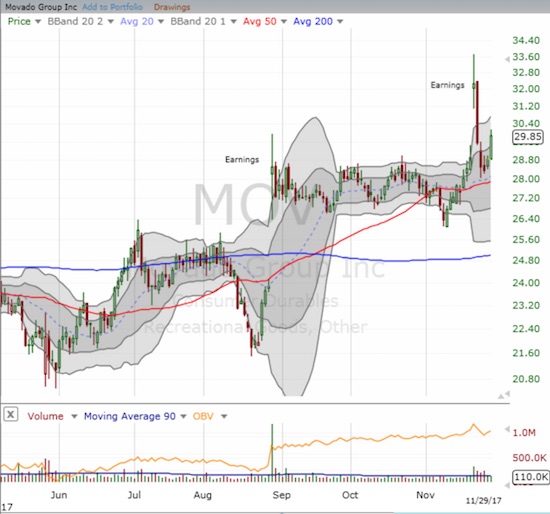
Movado (MOV) bounced neatly off support and looks ready to recapture lost post-earnings gains.
Ulta Beauty (ULTA)
The retail rally is now strong enough to change the tenor of trading in ULTA. Sellers no longer dominate the trading action. Today’s 2.8% gain confirmed a 50DMA breakout and put ULTA back in the “buy” column.
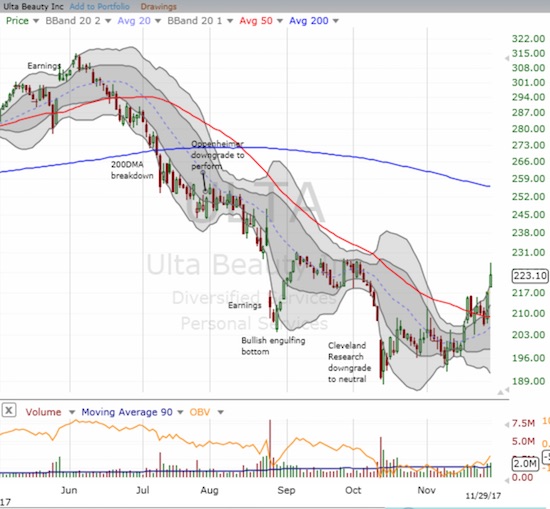
Ulta Beauty (ULTA) finally looks like it is bottoming with a confirmed 50DMA breakout.
Apple (AAPL)
In a previous post I gave numbers showing how AAPL’s market cap is significant compared to the size of the U.S. economy and contrasts with the tiny sliver of the workforce employed at the company. The incredible sucking sound that is Apple ratcheted up several more decibels with the rollout of a $1000 phone. After weeks of going back and forth, I decided to go as cheap as possible in upgrading my iPhone 5s and move to a 6s. The spiraling costs of carrying a phone made me stop and review what exactly I use on my phone and what I really need. I discovered that I am unwilling to pay for the sizzle or the features coming out in the latest phones (not to mention I was perfectly happy with my 5s but forced to upgrade to get on a different network).
The following product review solidified my opinion and demonstrated how Apple’s $1000 price point can force people to think harder about the purchase decision. I watched the video and realized that for the same money I spent upgrading to a 6s, I could have purchased a much more powerful Andorid phone for a similar price. Oh well. I am still FAR from ready to make the switch anyway…
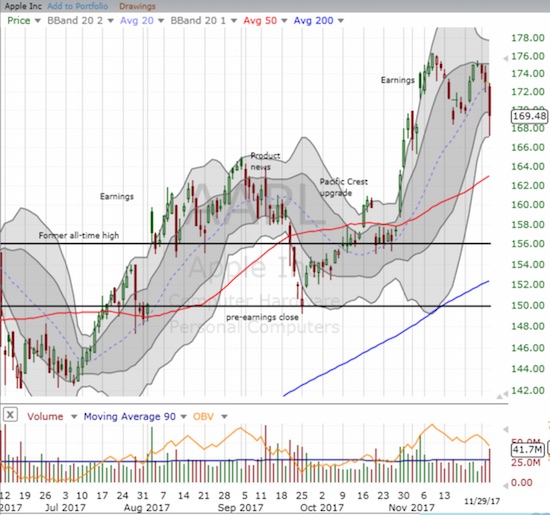
Apple (AAPL) lost 2.1% but bounced neatly off its lower-Bollinger Band (BB). The move finished a reversal of post-earnings gains that almost finished two weeks ago.
Parting thought: Goldman valuation call
Around this time of year, analysts are typically rolling out their annual bullish expectations for the next year’s stock market performance. Projected returns will range from 5% to 10% in order to conform to historic norms. This time around, Goldman Sachs decided to be a grinch of sorts. From Bloomberg:
“‘It has seldom been the case that equities, bonds and credit have been similarly expensive at the same time, only in the Roaring ’20s and the Golden ’50s,’ Goldman Sachs International strategists including Christian Mueller-Glissman wrote in a note this week. ‘All good things must come to an end’ and ‘there will be a bear market, eventually’ they said.”
Of course, bears have been making similar valuation calls for years now. It is thus easy to dismiss yet another siren call. What could be different this time is the cycle of monetary tightening slowly unfolding across the major central banks. I could not help thinking about Goldman’s call as I watched Bitcoin soar above $11,000 and then flame out all the way toward $9000.
$BTC plunges 14% in a matter of hours. Yowzah, yowzah, yowzah. #HODL #bitcoin - #SlopeCharts - https://t.co/ds0yOwilZP pic.twitter.com/M1K1SdwohK
— Tim Knight (@SlopeOfHope) November 29, 2017
Interestingly, Goldman’s report does not appear to recommend dumping everything overboard. Instead, the analysts are just preparing their audience to expect lower returns and higher risks. The video accompanying the article features a different analyst trumpeting the better profit outlook for Europe and Asia over the U.S. This year delivered Europe’s first year of profit growth since the recession. Asia experienced its first “decent” year of profit growth.
“Above the 40” uses the percentage of stocks trading above their respective 40-day moving averages (DMAs) to assess the technical health of the stock market and to identify extremes in market sentiment that are likely to reverse. Abbreviated as AT40, Above the 40 is an alternative label for “T2108” which was created by Worden. Learn more about T2108 on my T2108 Resource Page. AT200, or T2107, measures the percentage of stocks trading above their respective 200DMAs.
Active AT40 (T2108) periods: Day #444 over 20%, Day #258 over 30%, Day #58 over 40%, Day #6 over 50% (overperiod), Day #25 under 60% (underperiod), Day #32 under 70%
Daily AT40 (T2108)

Black line: AT40 (T2108) (% measured on the right)
Red line: Overbought threshold (70%); Blue line: Oversold threshold (20%)
Weekly AT40 (T2108)

Disclosure: Long AAPL calls, long ORLY, long TGT, long UVXY calls, long XLF call spread, long XRT calls, long MOV calls.
Follow Dr. Duru’s commentary on financial markets via more


