
Above The 40 – Breadth Returns To The Stock Market…Just In Time
AT40 = 55.3% of stocks are trading above their respective 40-day moving averages (DMAs)
AT200 = 56.8% of stocks are trading above their respective 200DMAs
VIX = 9.8 (volatility index)
Short-term Trading Call: cautiously bullish
Commentary
In my last Above the 40 post, I noted how the trading action made it hard for me to cling to my cautiously bullish short-term trading call. The stock market answered my criticism with a sudden burst of breadth. Who flipped the switch?
The S&P 500 (SPY) closed May with financials sounding fresh alarm bells. At the time, AT40 (T2108), the percentage of stocks trading above their respective 40DMAs, bounced back from its lows of the day. Yet, AT200 (T2107), the percentage of stocks trading above their respective 200DMAs, showed more signs of fatigue and highlighted the lack of breadth in the S&P 500’s rally.
The breadth finally showed up as June trading kicked off. The S&P 500 sprinted forward two days straight and returned to the top of its upward trending upper-Bollinger Bands (BBs). AT40 came along for the ride with an impressive move from 43.8% to 53.5% on Thursday and a close at 55.3% to end the week. A LOT of stocks woke up over the past two trading days. AT200 moved from 52.6% to 56.4% on Thursday to confirm the return of breadth. Friday was much less impressive with a fractional gain following a large fade from the intraday high.
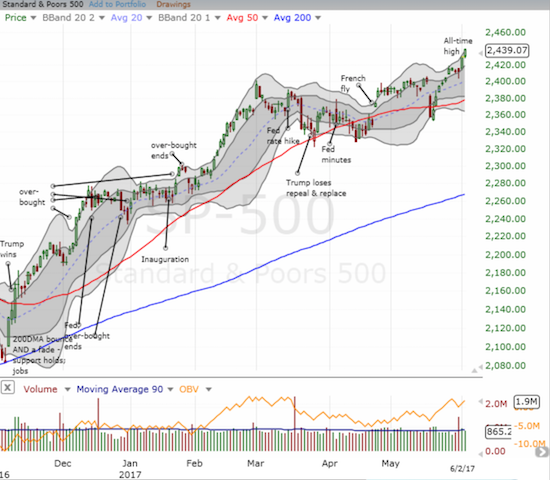
The S&P 500 sprinted to new all-time highs to start June trading.
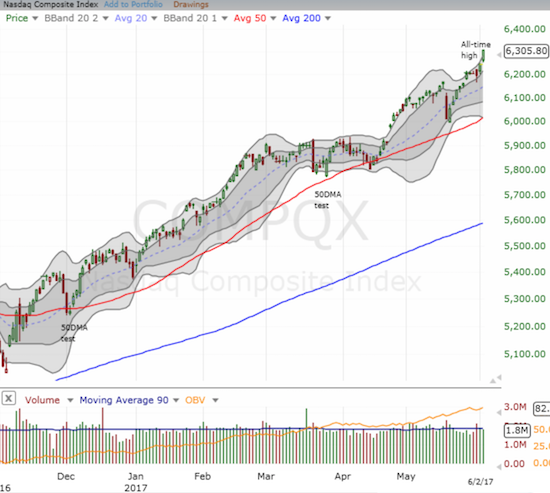
The tech laden Nasdaq (QQQ)* sprinted so strongly that its move looks like the early part of a parabolic rise.
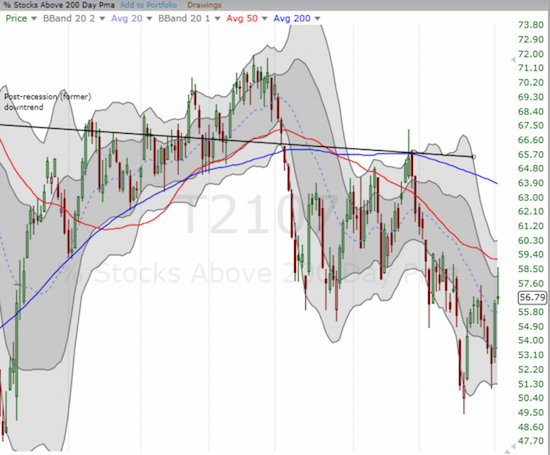
While breadth has returned, AT200 (T2107) did not quite erase its on-going breakdown.
Even small caps, the iShares Russell 2000 ETF (IWM), and mid caps, the SPDR S&P MidCap 400 ETF Trust (MDY) stretched out to return to the top of their current trading ranges.
The volatility index, the VIX, set a new 14-year low by closing a tiny fraction lower than its May 8th close. Day-by-day, the VIX is trying to extend the case for a new norm of extremely low volatility.
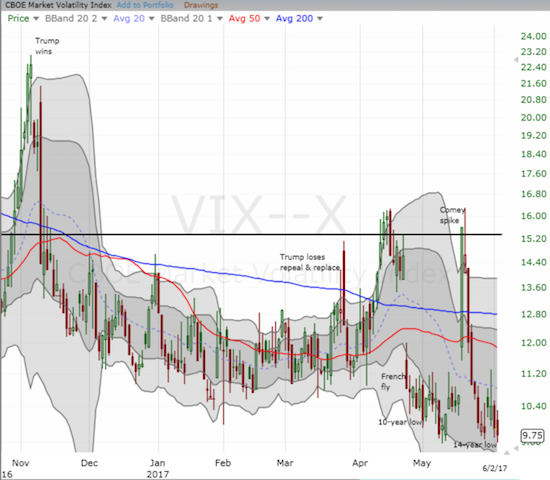
The volatility index, the VIX, just barely printed a new 14-year low.
The big story on Friday was the U.S. jobs report for May. The stock market clearly did not care about the low level of job creation but the bond market was a different a story (again). Interest rates dropped again. For example, the iShares 20+ Year Treasury Bond ETF (TLT) gained 1.2% and broke out above 200DMA resistance.
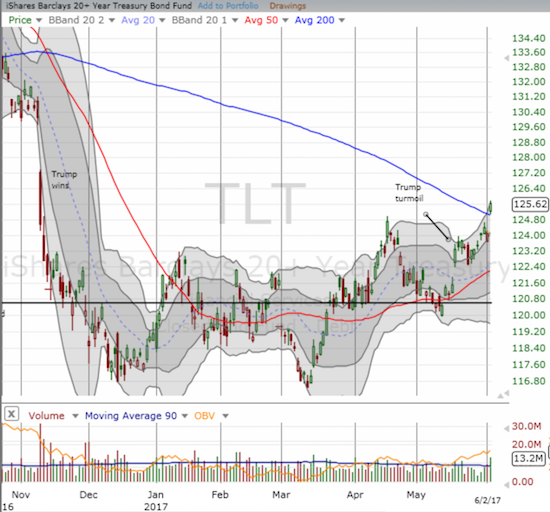
The iShares 20+ Year Treasury Bond ETF broke out above 200DMA resistance and set a new 7-month high. Is another Trump effect about to complete a full reversal?
Along with the lower rates, the U.S. dollar index (DXY0) weakened further. The dollar last closed this low in early October, 2016. I remain as bearish as ever on the dollar.
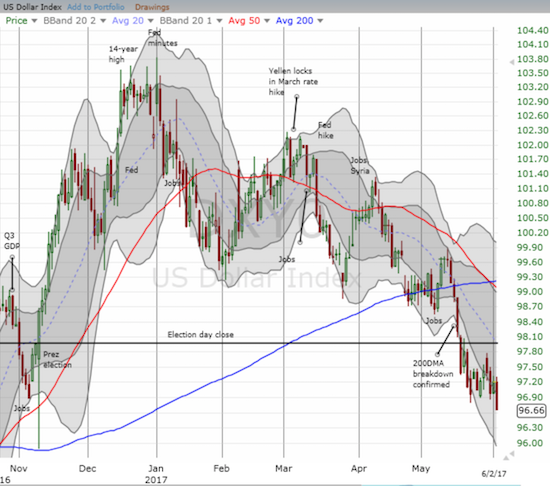
The U.S. dollar index (DXY0) continues its breakdown to ever lower levels. The post-election gains are becoming a distant memory.
Alongside the on-going departure from the dollar is uncertainty about the timing for the next two rate cuts from the U.S. Federal Reserve. Two weeks ago, the 30-day Fed Fund Futures dropped December, 2017 off the radar for rate hikes and left June as the last month for a rate hike in 2017. Today, the futures market is even more sure about the June rate hike and has pushed toward 50% for a subsequent hike in December, 2017. Futures are pricing in a 50/50 chance for that subsequent rate hike to happen in January. It is interesting to see that the dollar is not benefiting from the slightly higher odds for December and January compared to two weeks ago.
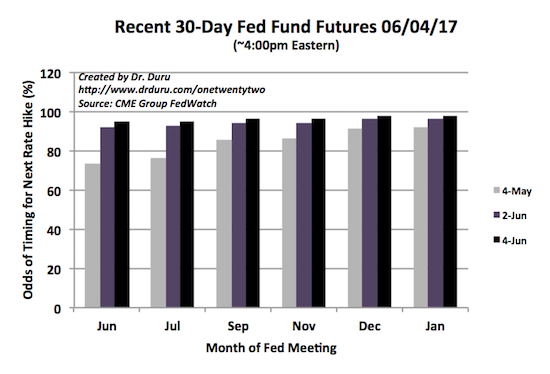
All systems go for a June rate hike.
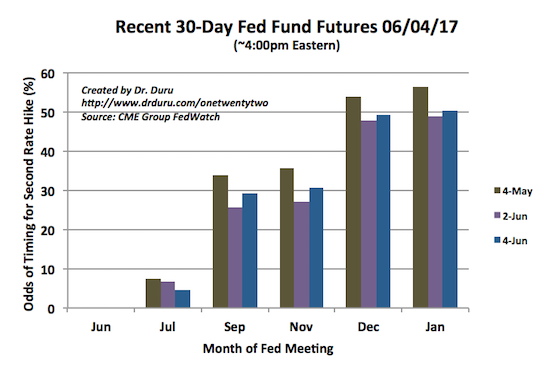
After June, the next rate hike has pushed out to next year…just barely.
Source: CME FedWatch Tool
With breadth returning and major indices experiencing substantial 2-day moves, I can throw a dart and find a good/promising stock chart. So I will just post an obligatory chart of Amazon.com (AMZN) which closed above $1000 for the first time ever. This historic achievement is timely given an article I wrote using Jeff Bezos as a shining example of a high school student who was the top of his class who also went on to be a top performer in the global economy. I wrote this piece as a strong counterpoint to a recent flurry of articles I have seen throwing (bizarre) shade on academic achievement.
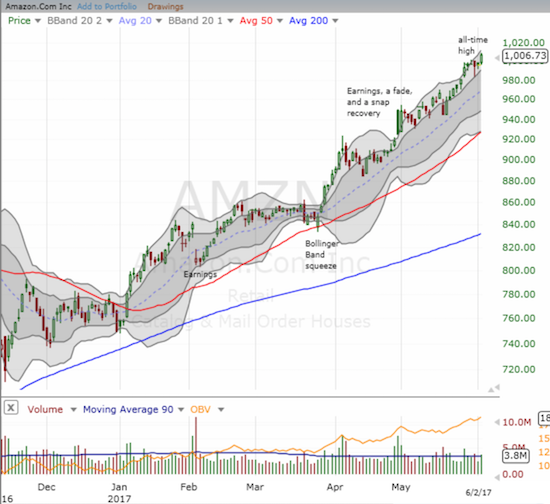
Amazon.com hits a fresh pinnacle of achievement: a four digit all-time high for the first time.
“Above the 40” uses the percentage of stocks trading above their respective 40-day moving averages (DMAs) to assess the technical health of the stock market and to identify extremes in market sentiment that are likely to reverse. Abbreviated as AT40, Above the 40 is an alternative label for “T2108” which was created by Worden. Learn more about T2108 on my T2108 Resource Page. AT200, or T2107, measures the percentage of stocks trading above their respective 200DMAs.
Active AT40 (T2108) periods: Day #321 over 20%, Day #141 over 30%, Day #8 over 40% (overperiod), Day #11 under 50%, Day #23 under 60%, Day #93 under 70%
Daily AT40 (T2108)

Black line: AT40 (T2108) (% measured on the right)
Red line: Overbought threshold (70%); Blue line: Oversold threshold (20%)
Weekly AT40 (T2108)

*
All charts created using freestockcharts.com unless otherwise stated
The charts above are my LATEST updates independent of the date of this given AT40 post. For my latest AT40 post click here.
Disclosure: net short the U.S. dollar
*Note QQQ is used as a proxy for a Nasdaq-related ETF
Follow Dr. Duru’s commentary on financial markets via more


