
Above The 40 – Another Bullish Rotation Out Of Tech Stocks
AT40 = 65.0% of stocks are trading above their respective 40-day moving averages (DMAs)
AT200 = 60.5% of stocks are trading above their respective 200DMAs
VIX = 11.3 (volatility index)
Short-term Trading Call: cautiously bullish
Commentary
During the big June 9th swoon in tech stocks, I was surprised to observe how well the stock market (in aggregate) performed. From Above the 40 at that time:
“While the carnage in big cap tech stocks was painfully clear – the PowerShares QQQ ETF (QQQ) declined 2.5% and the Nasdaq Composite declined 1.8% – most of the remaining stock universe was blissfully unaware of the pain.
My favorite technical indicator, AT40 (T2108), the percentage of stocks trading above their respective 40-day moving averages (DMAs), says it all. AT40 increased a solid 6.5 percentage points from 52.1% to 58.6%.”
Amazingly, a similar, albeit a little less dramatic, divergence happened to start the second half of the year. On July 3rd, a holiday-shortened trading day, the Nasdaq dropped 0.5% and the PowerShares QQQ ETF (QQQ) lost a convincing 1.1% which confirmed its 50DMA breakdown. At the same time, AT40 soared from 57.2% to 65.0%. My favorite technical indicator is now within sight of its first overbought reading (above 70%) in 106 trading days.
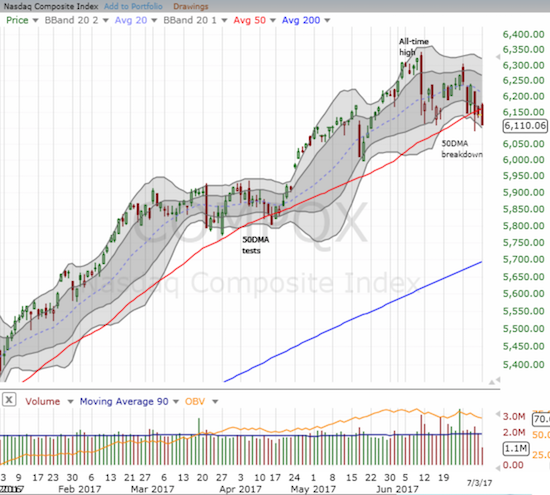
For the 3rd straight day, the Nasdaq closed below its 50DMA after trading above this trendline at some point in the trading day. So the breakdown has not yet been confirmed.
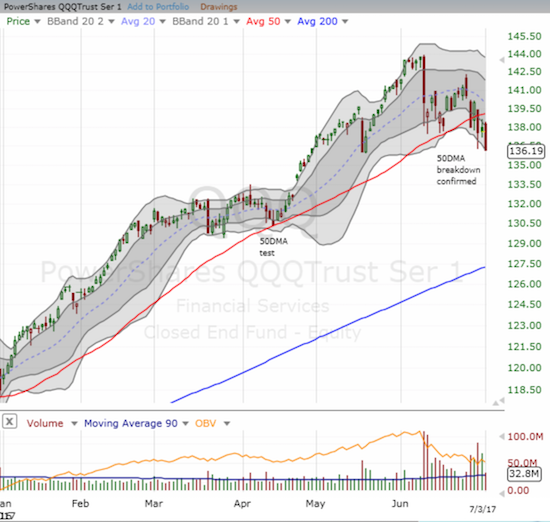
The PowerShares QQQ ETF (QQQ) confirmed its 50DMA breakdown with a close that exactly matched May’s closing low. Trading volume was average even though the trading day was shortened by the 4th of July holiday.
The S&P 500 (SPY) barely provided any clues to the divergence as it eked out a 0.2% gain after fading from its highs. I sold my SPY call options into the initial rally as I was nervous from seeing big cap tech wobble. I am still holding my QQQ call options with Apple (AAPL) put options as a pairs trade.
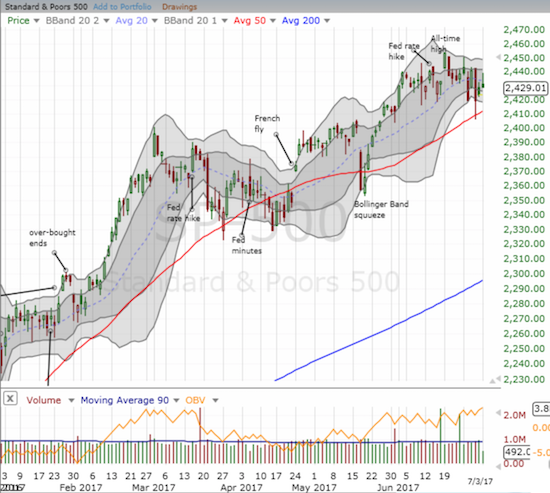
The S&P 500 closed below a downtrending 20DMA, but the index remains comfortably above an uptrending 50DMA.
Some of the biggest gainers of the day were PowerShares DB Agriculture ETF (DBA) at +1.5%, Energy Select Sector SPDR ETF (XLE) at +1.9%, and, most importantly, Financial Select Sector SPDR ETF (XLF) at 1.5%. Financials were bolstered by yet another pick-up in long-term Treasury bond yields. While I wish I loaded up on DBA when I intimated that the ag sector was oversold, I did use the extended relief rally in ag to lock in profits on my Deere (DE) call options.
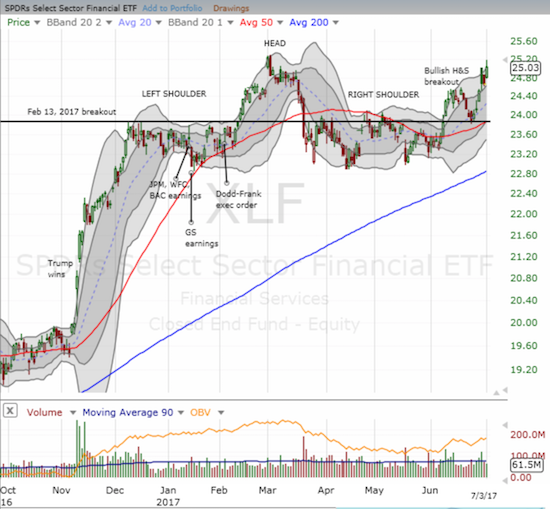
The Financial Select Sector SPDR ETF (XLF) resumed its bullish breakout from the previous head and shoulders topping pattern. A new high is finally around the corner.
Even retail managed a small rally with SPDR S&P Retail ETF (XRT) gaining 0.7% on the day (I decided here to lock in profits on my bullish call spread on Nordstrom (JWN) – still buying dips). In other words, money clearly left tech for other (cheaper) pastures. I consider this a bullish rotation because the money bleeding out of tech is not weighing the market down and instead is helping to broaden the market’s strength. When AT40 increases, more stocks are participating in the market’s gains.
With earnings season starting in about two weeks, we should get a major test of this process of cashing in on tech and loading up on the market’s laggards and bargains. In the meantime, I will be watching closely how AT40 behaves around the overbought threshold: a bearish fade from 70% or a bullish break above 70%. My read on the market will start with the technical results of this critical test.
Be careful out there!
“Above the 40” uses the percentage of stocks trading above their respective 40-day moving averages (DMAs) to assess the technical health of the stock market and to identify extremes in market sentiment that are likely to reverse. Abbreviated as AT40, Above the 40 is an alternative label for “T2108” which was created by Worden. Learn more about T2108 on my T2108 Resource Page. AT200, or T2107, measures the percentage of stocks trading above their respective 200DMAs.
Active AT40 (T2108) periods: Day #346 over 20%, Day #160 over 30%, Day #27 over 40%, Day #6 over 50%, Day #1 over 60% (overperiod ending 8 days under 60%), Day #106 under 70% (underperiod)
Daily AT40 (T2108)

Black line: AT40 (T2108) (% measured on the right)
Red line: Overbought threshold (70%); Blue line: Oversold threshold (20%)
Weekly AT40 (T2108)

* All charts created using freestockcharts.com unless otherwise stated
The charts above are my LATEST updates independent of the date of this given AT40 post. For my latest AT40 post click here.
Be careful out there!
*Charting notes: FreeStockCharts.com uses midnight U.S. Eastern time as the close for currencies.
Disclosure: Long QQQ call options
Follow Dr. Duru’s commentary on financial markets via more


