
Above The 40 – A Swift Break From The Market’s Downward Drip
AT40 = 45.8% of stocks are trading above their respective 40-day moving averages (DMAs)
AT200 = 53.8% of stocks are trading above their respective 200DMAs
VIX = 11.8 (10.4% loss)
Short-term Trading Call: cautiously bullish
Commentary
It was one of THOSE days for anyone or anything standing in the way of the buyers.

An overwhelming rush to the basket… (Philadelphia 76ers Joel Embiid vs. L.A. Lakers rookie Lonzo Ball)
Source: Twitter
Right after I pointed out the mildly ominous indicators of a market that “wants to drop,” the buyers finally stepped into the market with conviction again. AT40 (T2108), the percentage of stocks trading above their respective 40DMAs, jumped from 41.1% to 45.8%. The S&P 500 (SPY) launched higher by 0.8%. Together, these two combine to suggest that the recent selling phase, as mild as it was, has ended.
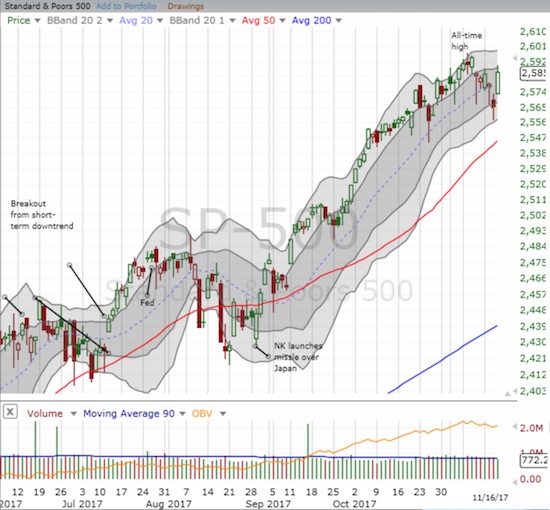
The S&P 500 (SPY) made a 180 degree turn to return to the high of the week.
Wednesday’s intraday low on the S&P 500 neatly tapped the lower-Bollinger Band (BB). That move looks like a bottom. A close below this level will flip me to a cautiously bearish trading bias. Otherwise, I consider Thursday’s move as a confirmation follow-through for the bottom. With AT40 at 45.8%, the market has plenty of upside potential ahead as the market reaches for overbought status (above 70%).
The volatility index, the VIX, added its vote for a bottom. After gaining 7 of the last 8 days, the VIX finally succumbed to the volatility faders who earlier could only take the VIX off its highs. This time, the pressure started from the open and barely relented. Perhaps Wednesday’s lofty intraday high was a “close enough” test of the 15.35 pivot line.
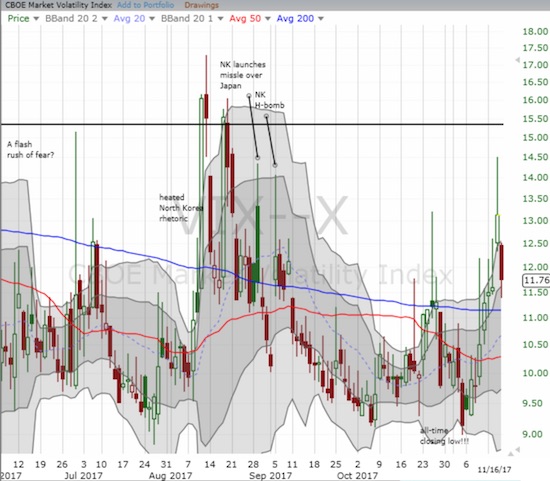
The volatility faders look like they have regained control over the volatility index, the VIX.
The headline news suggests that the twists and turns of tax reform are tugging away at the market, but I am very skeptical the market has attempted to price in any benefits. Such a move may not happen until companies start providing estimates of such benefits AFTER tax reform legislation passes. In the meantime, the amazing post-earnings 10.9% gain by Wal-Mart (WMT) is quite sufficient to explain the market’s good mood: death by Amazon.com (AMZN) is suddenly far from inevitable again.
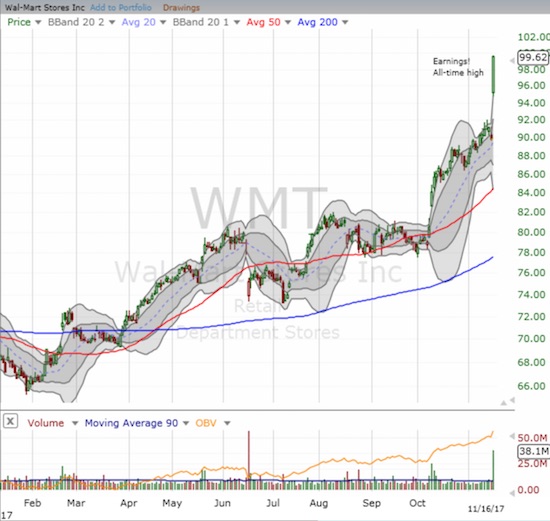
Wal-Mart Stores, Inc. (WMT) soared to a fresh all-time high.
Despite the day’s rally, the Australian dollar (FXA) still sticks out like a sore bearish thumb. While weak economic data is weighing on the currency, I still take its follow-through selling against the Japanese yen (JPY) as confirmation of a breakdown for AUD/JPY. If the breakdown continues through the end of next week, I will anticipate a fresh round of selling for the stock market as well. I reloaded on a ProShares Ultra VIX Short-Term Futures (UVXY) call option for what I hope will be last round until at least the January earnings season.
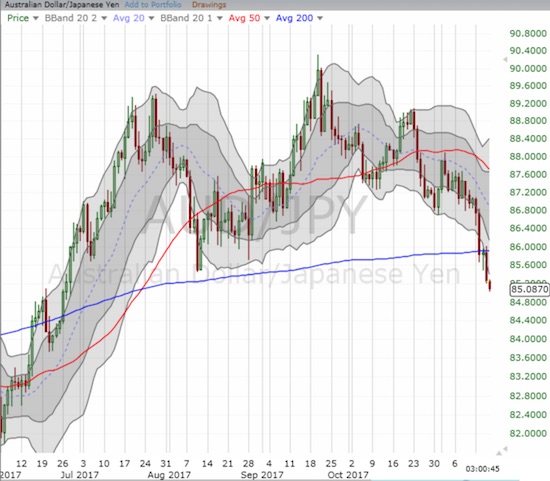
AUD/JPY confirmed its breakdown below critical 200DMA support and a bearish head and shoulders pattern.
STOCK CHART REVIEWS
ShotSpotter (SSTI)
In my last Above the 40 post, I pointed out several cases where initial post-earnings euphoria quickly gave way to sellers. One of my favorite small cap companies just suffered the same effect. SSTI made a new all-time closing high after earnings last week and even got one more day of follow-through. Sellers took over from there and sent the stock to the current retest of 20DMA support. If buyers confirm support, I plan to add to my growing position. Note that I am wary of the expiration of the lockup period for insiders, typically 6 months from the IPO. I am trying to be optimistic that the market will welcome the insider shares as a Christmas gift of additional liquidity and bigger buyers step in to soak up the shares. (I plan to write up earnings in the next week or two).
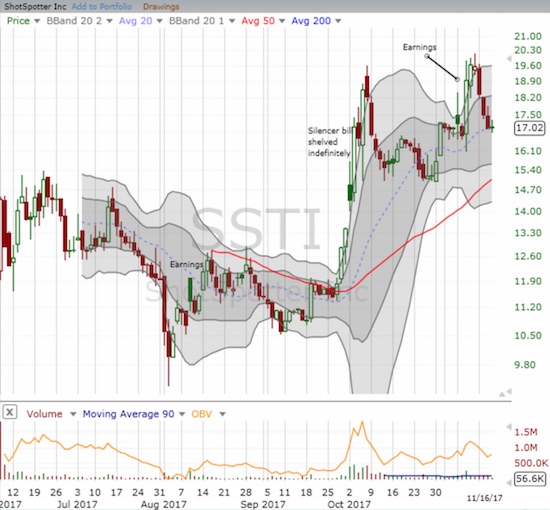
ShotSpotter (SSTI) reversed almost all its post-earnings gains and now retests 20DMA support.
“Above the 40” uses the percentage of stocks trading above their respective 40-day moving averages (DMAs) to assess the technical health of the stock market and to identify extremes in market sentiment that are likely to reverse. Abbreviated as AT40, Above the 40 is an alternative label for “T2108” which was created by Worden. Learn more about T2108 on my T2108 Resource Page. AT200, or T2107, measures the percentage of stocks trading above their respective 200DMAs.
Active AT40 (T2108) periods: Day #436 over 20%, Day #250 over 30%, Day #50 over 40% (overperiod), Day #6 under 50% (underperiod), Day #17 under 60%, Day #24 under 70%
Daily AT40 (T2108)

Black line: AT40 (T2108) (% measured on the right)
Red line: Overbought threshold (70%); Blue line: Oversold threshold (20%)
Weekly AT40 (T2108)

Disclosure: Long SSTI, long UVXY call option, short AUD/JPY.
Follow Dr. Duru’s commentary on financial markets via more


