
Above The 40 – A Stock Market That Wants To Drop
AT40 = 41.1% of stocks are trading above their respective 40-day moving averages (DMAs)
AT200 = 51.7% of stocks are trading above their respective 200DMAs
VIX = 13.1 (as high as 14.5)
Short-term Trading Call: cautiously bullish
Commentary
The narrowing rally in the stock market has officially resolved into a sell-off. The downward slide is a very slow burn, but the market looks like it wants to drop as key levels get broken.
AT40, the percentage of stocks trading above their respective 40-day moving averages (DMAs), has declined in a near straight line since it last peaked in overbought territory on October 5, 2017. My favorite technical indicator closed at 41.1% and approaches “close enough” oversold territory (the 30s%). Both AT40 and AT200, the percentage of stocks trading above their respective 200DMAs, closed at 3-week lows.
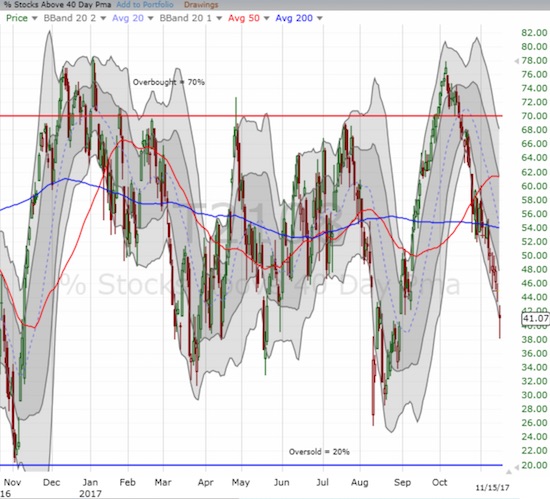
AT40 (T2108) closed at a near 3-month low as part of a convincing 6-week decline.
The orderliness of the decline surprised me, especially during October, given it never resolved into a (traditional) October sell-off for the broader market. For example, the S&P 500 (SPY) continued rising throughout October and did not peak until a month after AT40 peaked. The long overdue resolution of the bearish divergence has now taken the S&P 500 to a new three week low.
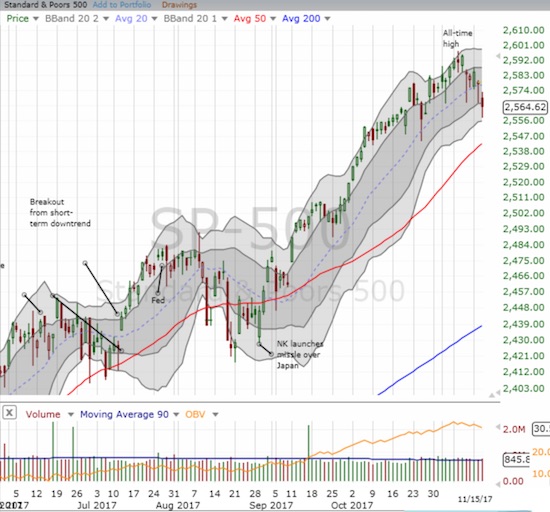
The S&P 500 broke through the intraday lows of the last week – levels that buyers staunchly defended. No longer.
The S&P 500 closed below its rapidly uptrending 20-day moving average (DMA) for the FIRST time since August 29th. This change in the nature of trading increased the likelihood that the S&P 500 will retest support at its 50DMA within the next two weeks at the current pace. I am guessing the (successful) test will happen just ahead of Black Friday (November 24th) which tends to be a bullish turning point in the market.
The volatility index, the VIX, is actually confirming the downward bias. Despite the consistent efforts of volatility faders, the VIX is up 44% in two weeks with gains 7 of the last 8 trading days. The rally is almost a stealth rally because each day the VIX fades significantly off its intraday high. This is a pattern I finally traded on today.
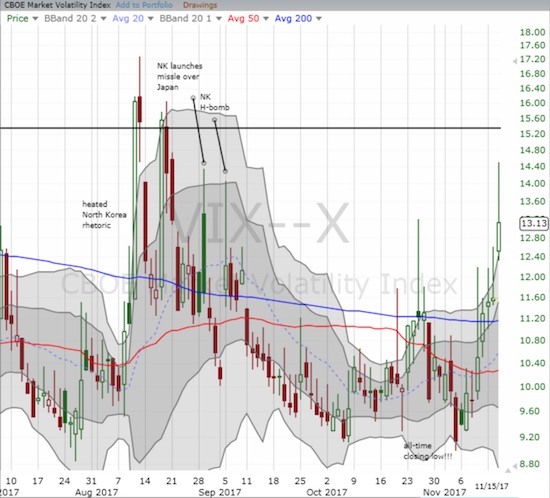
The volatility index, the VIX, is marching toward another rendezvous with the all-important 15.35 pivot line.
Small caps continue to add to the deteriorating picture. This week, the iShares Russell 2000 ETF (IWM) broke down and stayed below its 50DMA. Each day’s loss is fractional for IWM, but the trend is steady and clear.
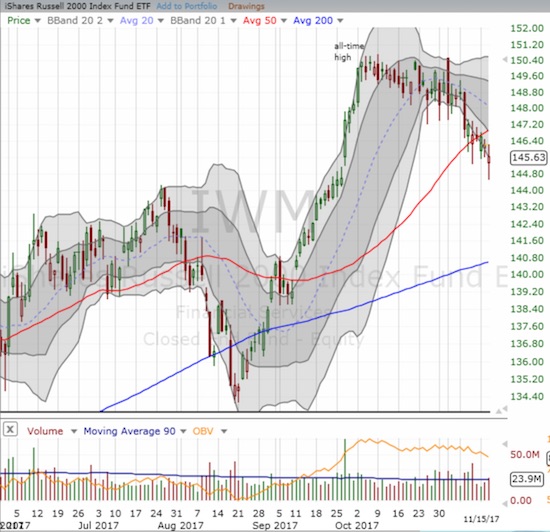
The iShares Russell 2000 ETF is following/leading AT40 (T2108) since an early October peak. The 50DMA breakdown is bearish for the index.
Oil was a bright spot until this week. United States Oil (USO) rallied off its June low to a November peak and a 32% gain. On Tuesday, USO broke down from a brief and tight consolidation range. Perhaps oil was the straw that broke the S&P 500’s back. The Energy Select Sector SPDR ETF (XLE) is negative for the month as it completed a full reversal of a bullish 200DMA breakout and confirmation of 50DMA support from the beginning of November.
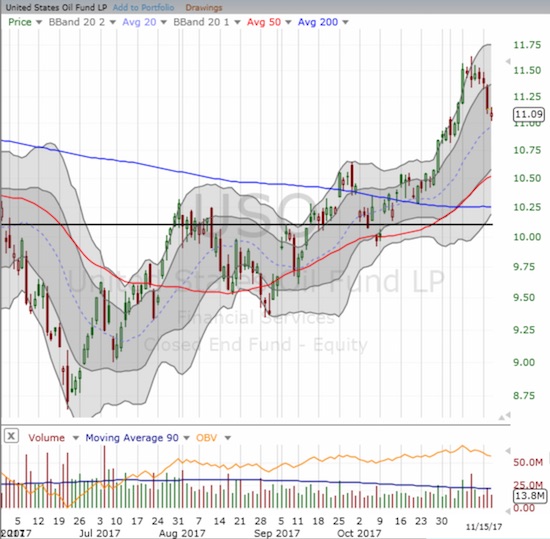
United States Oil looks like a buy on the dip given its multi-month run-up.
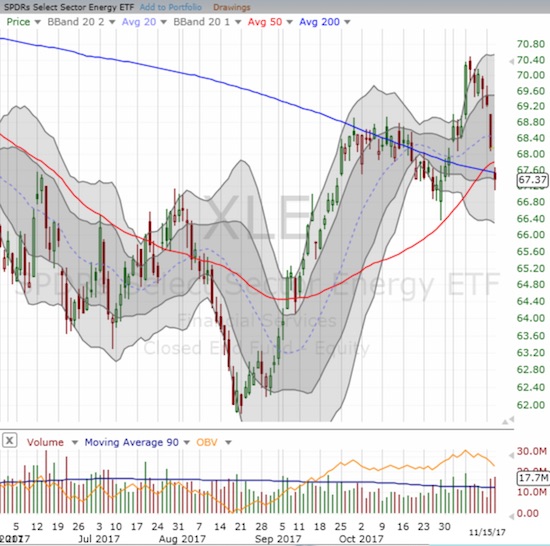
The Energy Select Sector SPDR ETF reversed a bullish breakout as quickly as it sprinted out the gate.
The Australian dollar (FXA) versus the Japanese yen (FXY) added to the mildly ominous backdrop by cracking 200DMA support. A months-long topping pattern in AUD/JPY looks ready for confirmation with a shoulder in July, a shoulder in October, and a head in September. A break of the August low would complete the bearish shift.
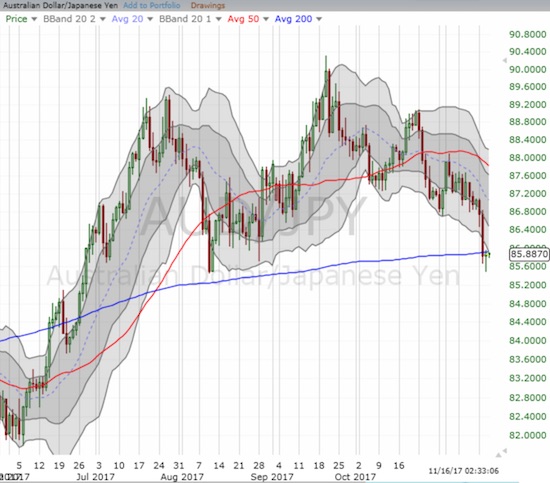
The Australian dollar versus the Japanese yen (AUD/JPY) finally cracked 200DMA support. The pair is close to confirming a head and shoulders type of top.
The Financial Select Sector SPDR ETF (XLF) is trying to hold off the barbarians at the gate. Sellers gapped XLF below 50DMA support, but buyers quickly rushed in to produce a gain for the day. A resumption of selling in financials will essentially confirm the market’s rendezvous with (essentially) oversold conditions.
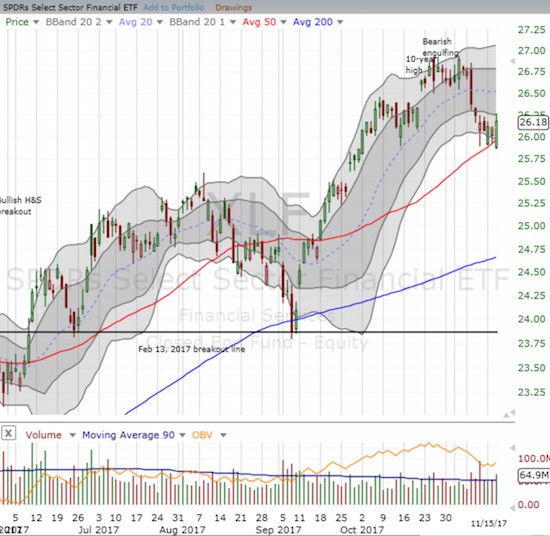
The Financial Select Sector SPDR ETF fell hard from its 10-year high but buyers are trying to defend critical 50DMA support.
I remain cautiously bullish in spite of all the mildly bearish signs. As I stated in previous posts during the bearish divergence, I am more focused on buying into this dip than trying to time the opportunity to short into it. I think the sloth-like pace of the sell-off is vindicating my approach, but the extended duration of this weakness increases the difficulty of making short-term bullish trades.
STOCK CHART REVIEWS
Caterpillar (CAT)
CAT is a poster child for the difficulty of short-term trades on the long side. On Tuesday, I felt like a genius with the stock showing enough relative strength to motivate me to keep holding. On Wednesday, I felt mounds of disappointment. CAT lost 2.5% and now looks ready to fill its post-earnings gap as it closed at a new post-earnings low.
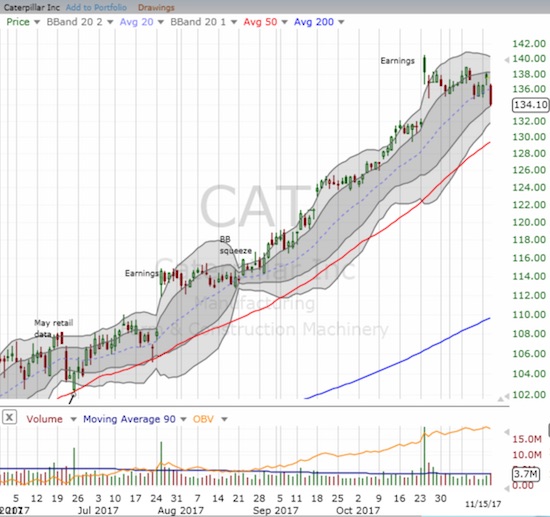
Caterpillar swooned to a new post-earnings low on the way to what looks like an imminent reversal of its post-earnings gains.
International Business Machines (IBM)
I have become particularly sensitive to earnings reversals given the mildly negative backdrop of the market. I was stunned to notice today that International Business Machines completed the reversal of its monster 8.9% post-earnings gain. IBM even managed two more days of buying follow-through in the immediate wake of earnings. IBM’s chart is a resounding example of the bearishness of a post-earnings low for a stock that gapped higher in response to earnings.
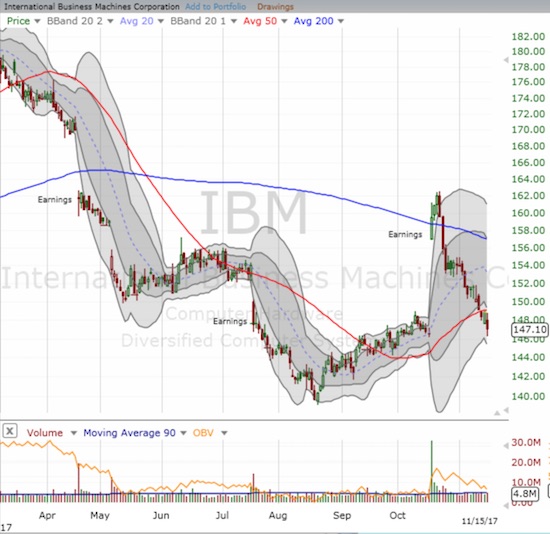
International Business Machines enjoyed a brief moment in the sun with a 200DMA breakout. This week, IBM broke DOWN below 50DMA support and essentially finished an startling reversal of fortune.
Apple (AAPL)
Even the mighty AAPL is stumbling into a complete reversal of post-earnings gains. My trade for the week is of course bust, but I forged ahead and tentatively started a fresh play for next week.
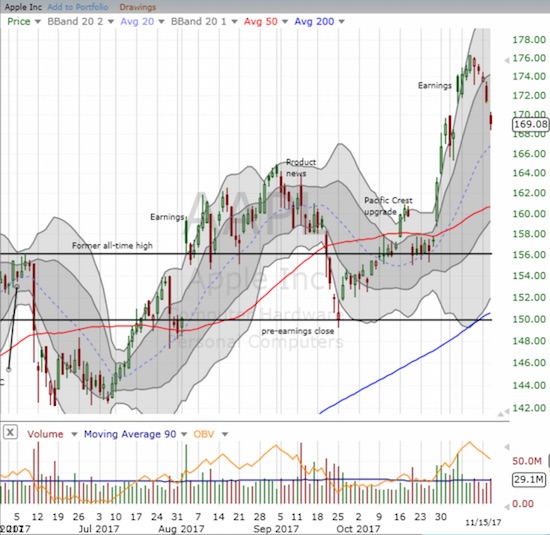
Apple dropped into “no man’s land” as it nears a complete post-earnings reversal. Natural support is bit lower at the uptrending 20DMA. I think it will take a very bearish swoon in the general market to force the issue with a 50DMA test.
General Electric (GE)
I am still watching GE in amazement. I laid out the technical case for GE three weeks ago but never once considered shorting the stock. GE has lost another 18% since then as a dividend cut renewed the passions of GE’s sellers and detractors.
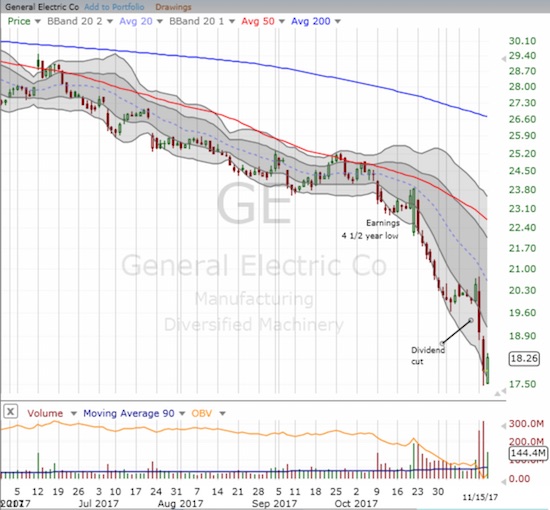
General Electric is rushing headlong to the first pick in the draft for Dog of the Dow! The stock now trades near a 5 1/2 year low.
Buffalo Wild Wings (BWLD)
At least the chicken trade gained new life with a buyout offer from Roark Capital Group for BWLD. This deal seemed to put a (temporary) floor across the casual dining/quick service space. Perhaps I dumped El Pollo Loco Holdings (LOCO) a tad too early…
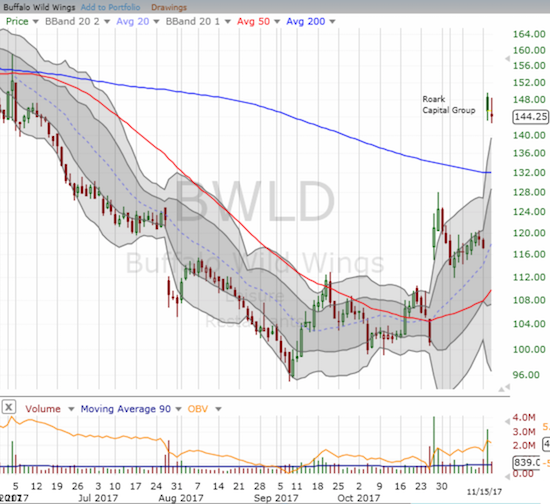
Buffalo Wild Wings took flight again thanks to Roark Capital Group. However, will management be satisfied going out at this price?
Active AT40 (T2108) periods: Day #435 over 20%, Day #249 over 30%, Day #49 over 40% (overperiod), Day #5 under 50% (underperiod), Day #16 under 60%, Day #23 under 70%
Daily AT40 (T2108)

Black line: AT40 (T2108) (% measured on the right)
Red line: Overbought threshold (70%); Blue line: Oversold threshold (20%)
Weekly AT40 (T2108)

*
All charts created using freestockcharts.com unless otherwise stated
Disclosure: long AAPL calls, long CAT calls, long XLF call spreads
Follow Dr. Duru’s commentary on financial markets via more


