
Above The 40 – A Quiet Pre-Fed Breakdown For The Stock Market
AT40 = 43.3% of stocks are trading above their respective 40-day moving averages (DMAs)
AT200 = 60.5% of stocks are trading above their respective 200DMAs
VIX = 11.9 (volatility index)
Short-term Trading Call: neutral
Commentary
Times like these really put AT40 (T2108), the percentage of stocks trading above their respective 40-day moving averages (DMAs), to test.
The stock market’s underpinnings continued their slides on Wednesday with AT40 dropping to a level last seen the day after the U.S. Presidential election. AT200 (T2107), the percentage of stocks are trading above their respective 200DMAs, dropped in unison and confirmed the end of its uptrend. Bullish momentum has come to an end.
(Click on image to enlarge)
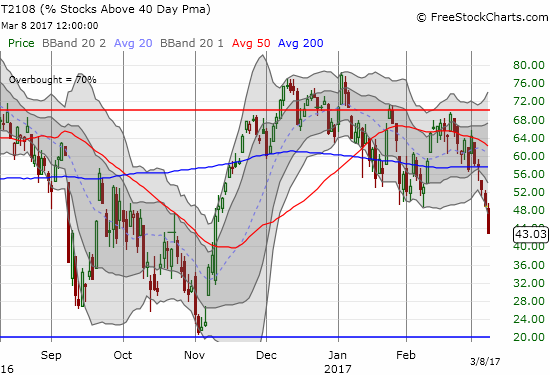
AT40 (T2108) traded below 50% for the first time since the day after the U.S. Presidential election.
(Click on image to enlarge)
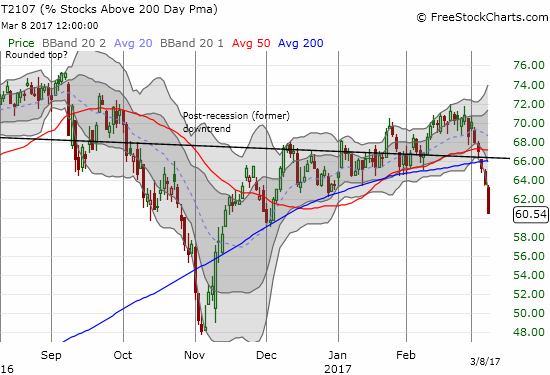
AT200 (T2107) plunged to a new three-month low and confirmed the end of its post-election uptrend.
A trader may never guess at the weakening foundations while watching the S&P 500 (SPY) drip ever so slowly downward. The hardy index STILL did not close below the low of the day before its last bullish breakout – a threshold I have held out as the dividing line between a neutral and a bearish stance on the market.
(Click on image to enlarge)
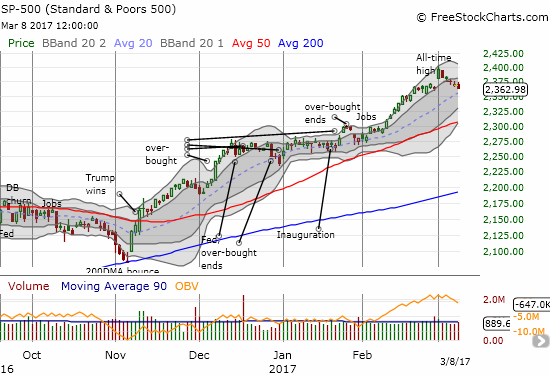
The S&P 500 (SPY) fell a mere 0.2% and once again stopped short of triggering a bearish trading call.
The volatility index, the VIX, once again showed little interest in flagging trouble ahead.
(Click on image to enlarge)
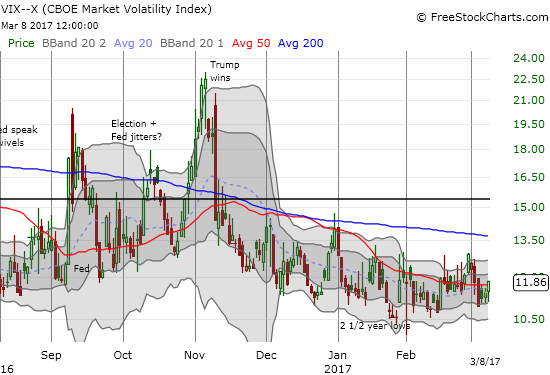
The volatility index, the VIX, still shows little concern as it gained just 3.6% on the day. However, a bottom may be forming?
With this conflicting setup creating what looks like a “quiet” breakdown a week before the Fed meets, I decided to look at some other technical indicators related to AT40: T2114 and T2116. These indicators measure the percentage of stocks that are a certain distance below their 40DMAs. The bigger the number, the worse off the stock market is. T2114 measures the distance by one channel – think of it as a Bollinger Band channel or approximately one standard deviation. T2116 is two standard deviations. The charts below suggest there is increasing stress under the hood of an otherwise serene market. A quiet breakdown is indeed underway. The upshot is that a fresh BUYING opportunity will likely accompany these indices on a retest of former highs. In other words, whatever extended sell-off awaits around the corner will likely be shallow and brief (don’t blink?).
(Click on image to enlarge)
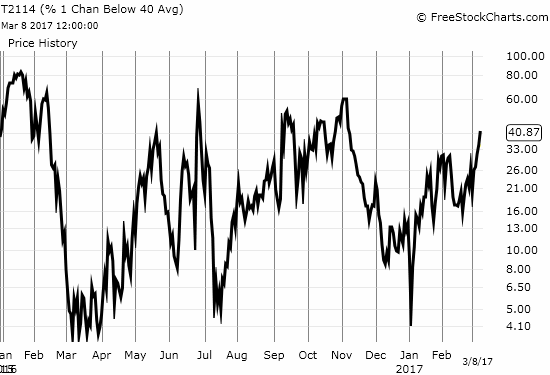
T2114, the percentage of stocks trading “one standard deviation” below their respective 40DMAs, returned to pre-elections levels and confirmed increasing stress among stocks.
(Click on image to enlarge)
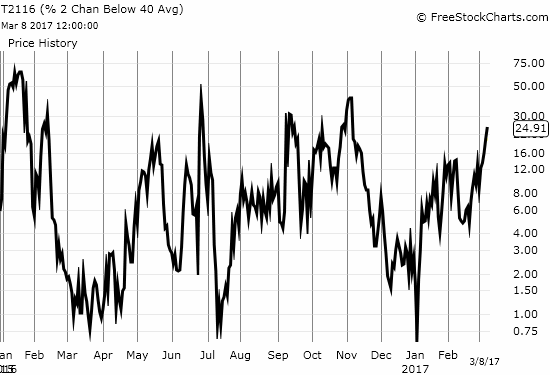
Like T2114, T2116, the percentage of stocks trading TWO “standard deviations” below their respective 40DMAs, fell to pre-election levels and confirmed growing stress under the relative calm of the market.
The new high / new low ratio (T2117) also helps display the sudden change in market momentum. New highs went from close to 100% of the total of stocks making new 52-week highs and new 52-week lows on March 1st (93.5%) to just 32.7% one week later.
(Click on image to enlarge)
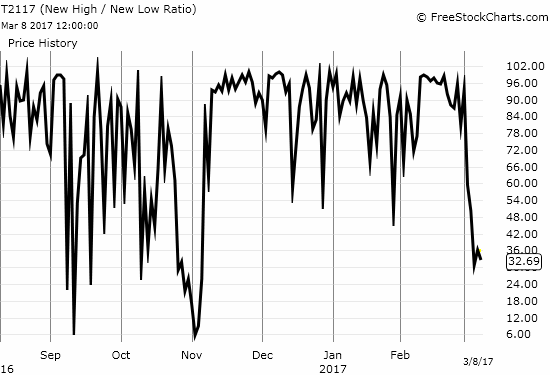
The New High / New Low ratio (T2117) has taken a sudden and abrupt turn for the worse: its lowest point yet since the aftermath of November’s presidential election.
A large drop in oil prices drove a good portion of the incremental stress and breakdowns. From Barron’s (“Oil (GASP) Plummets”):
“The U.S. Energy Information Administration reported that domestic crude supplies for last week came in 8.2 million barrels higher. That means total commercial inventories hit a weekly record level of 528.4 million — its ninth consecutive climb.
The EIA also raised its forecast on crude production for this year and next. This year crude production will average at 9.21 million barrels a day, up from the previous 8.98 million forecast. In 2018, output is expected to hit 9.73 million barrels, up slightly from the 9.53 million call.”
The big surprise inventory build took out the oil complex in profound ways. The Energy Select Sector SPDR ETF (XLE) sliced right through critical support.
(Click on image to enlarge)
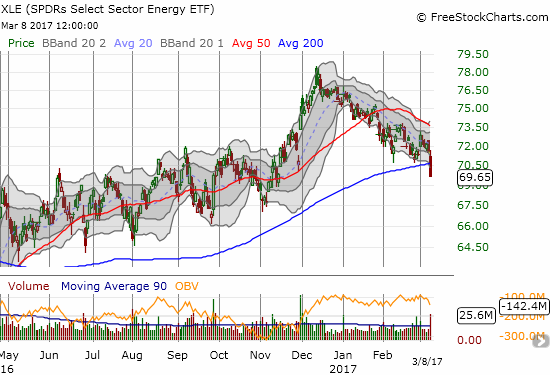
The Energy Select Sector SPDR ETF (XLE) sliced through 200DMA support with a 2.6% loss.
When I pointed out the breakdown in VanEck Vectors Russia ETF (RSX) and made a play on the Direxion Daily Russia Bear 3X ETF (RUSS), I vaguely assumed something Russia-specific was brewing even as other emerging markets were hurting. Now it looks like traders were trying to get ahead of the oil plunge?
(Click on image to enlarge)
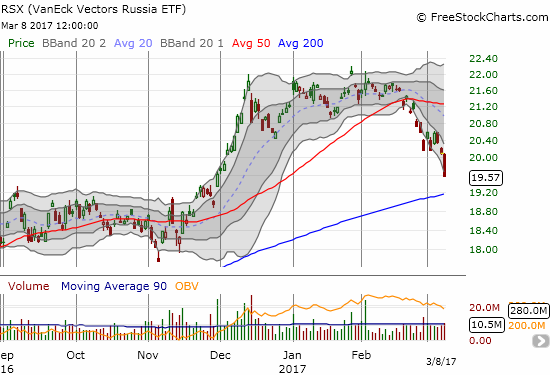
The VanEck Vectors Russia ETF (RSX) dropped 2.5% as selling extended the 50DMA breakdown
Stocks across the commodity complex continued to suffer. My play on Freeport McMoran (FCX) looks certain to fail now that FCX has punctured 50DMA support.
(Click on image to enlarge)
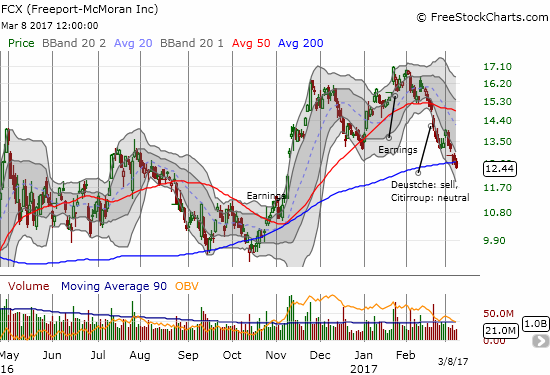
Freeport McMoran (FCX) broke down below 200DMA support as it continued to tumble through its downward trending lower-Bollinger Band (BB) channel.
A resurgent U.S. dollar index (DXY0) likely added to the weight on the commodities complex. The dollar finished a complete recovery from last week’s selling that accompanied Janet Yellen’s speech last week. An extremely positive number from the ADP employment report pushed rate expectations ever higher.
(Click on image to enlarge)
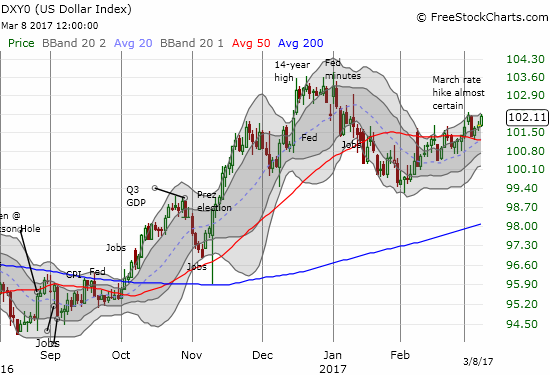
The U.S. dollar (DXY0) finished recovering its loss from last week’s “sell the news” reaction to Fed Chair Janet Yellen’s speech which affirmed the coming of a March rate hike.
(Click on image to enlarge)
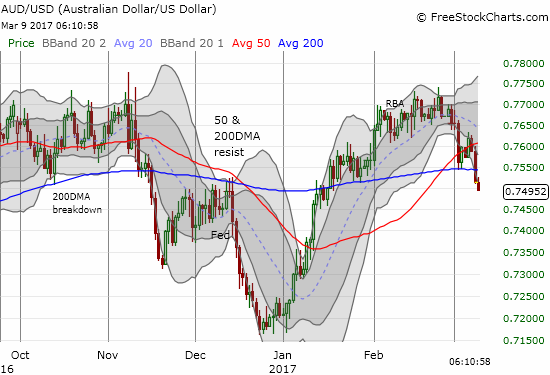
The U.S. dollar punched the Australian dollar, an important commodity currency, through 200DMA support.
Gold and silver could not withstand the pressure. Both SPDR Gold Shares (GLD) and iShares Silver Trust (SLV) cracked through critical support at their respective 50DMAs.
(Click on image to enlarge)
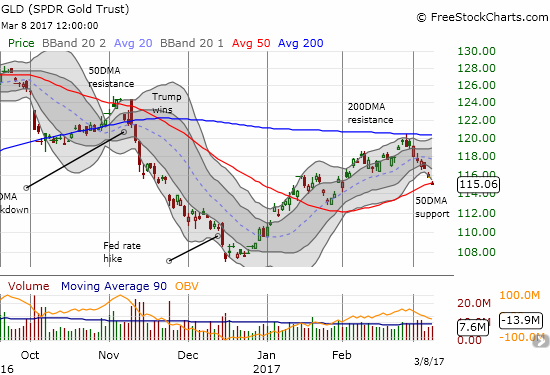
The SPDR Gold Shares (GLD) gapped down and broke down below 50DMA support for a 0.6% loss.
(Click on image to enlarge)
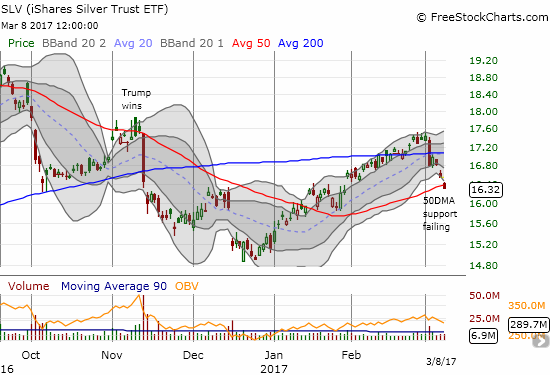
The iShares Silver Trust (SLV) accompanied GLD in breaking 50DMA support.
So it looks like I got a bit too cute in closing out my gold versus bonds pairs trade and applying the profits on the put options on the iShares 20+ Year Treasury Bond (TLT) to more GLD call options. Per plan, I did rush back into TLT put options as gold’s weakness continued. I flipped those for a small profit on TLT’s gap down. Extremely bullish silver speculators are likely mightily hurting now.
(Click on image to enlarge)
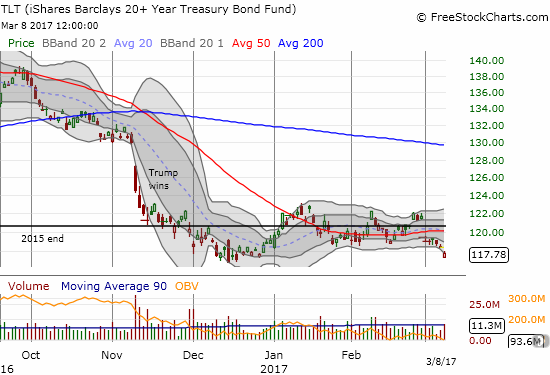
The iShares 20+ Year Treasury Bond (TLT) gapped down to the bottom of its recent trading range. Buyers stepped in from there.
The breakdown theme played out with small caps as well. The iShares Russell 2000 (IWM) gave up its 50DMA support and put in play its 2017 low.
(Click on image to enlarge)
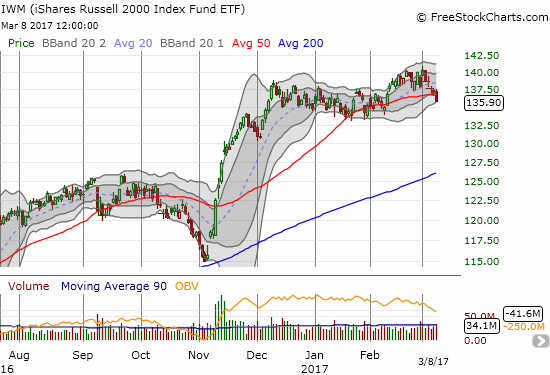
The iShares Russell 2000 (IWM) broke down below 50DMA support and put 2017 lows into play.
Last week I pointed out how Tesla (TSLA) just missed confirming a bullish bounce off 50DMA support. Today, TSLA returned to a bearish setup by following the day’s breakdown theme…
(Click on image to enlarge)
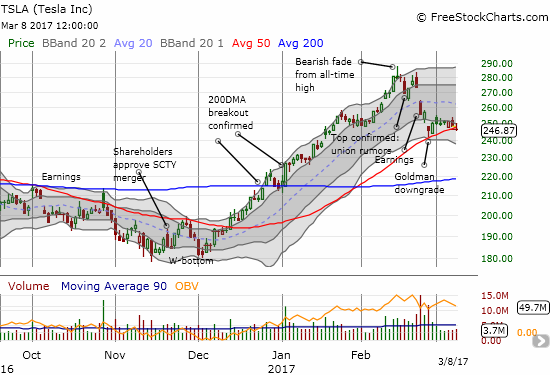
Tesla (TSLA) closed below 50DMA support for the first time since last December.
There were a few brights spots of note.
The iShares Nasdaq Biotechnology (IBB) proved out my observation that President Trump’s market moving power has transitioned to one of causing volatility that the market reverses relatively quickly. On Tuesday, President Trump once again talked lower drug prices for Americans, and once again IBB reacted by selling off. THIS time, IBB bounced right back the next day. I bought a call option on the pullback form the high of the day.
(Click on image to enlarge)
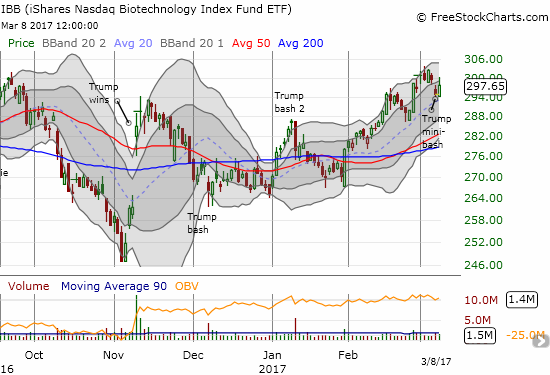
The iShares Nasdaq Biotechnology (IBB) rebounded immediately from Trump’s latest bash.
Financials actually gapped up to start the day. The subsequent selling closed out the Financial Select Sector SPDR ETF (XLF) with no gain.
(Click on image to enlarge)
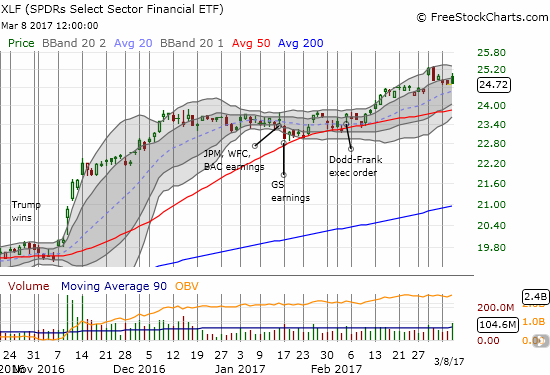
Financials helped prevent a larger market decline by closing flatline. The Financial Select Sector SPDR ETF (XLF) even gapped up before succumbing to sellers.
Even Snap Inc. (SNAP) provided a bright spot. SNAP followed-through on my bullish reversal on the shares. Once again, the 5-minute chart shows the dynamism in the SNAP trade. This granularity has helped me spot key pivot points. Notice how SNAP reversed the opening gap up before powering higher. That is bullish follow-through on an attempt to carve out some kind of bottom.
(Click on image to enlarge)
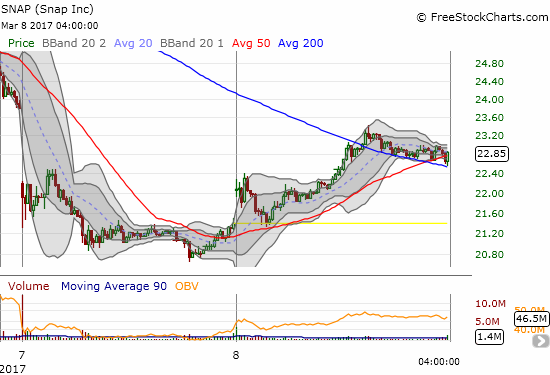
Snap Inc. (SNAP) gained 6.4% on the day after a wobbly open and failing to hold its intraday high.
Even homebuilders had a good day, presumably on the strong jobs outlook.
(Click on image to enlarge)
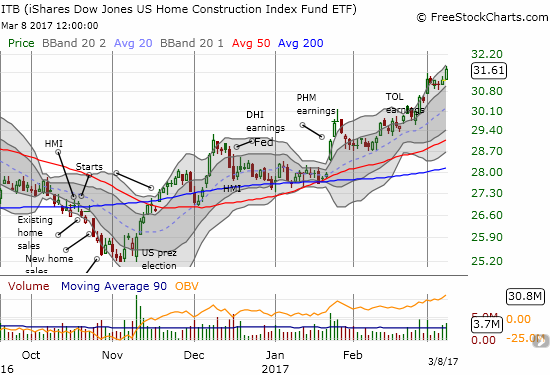
The iShares US Home Construction (ITB) gained 1.3% in a rare demonstration of relative strength. ITB now trades at a new 9+ year high.
Overall, it looks like next week’s meeting of the U.S. Federal Reserve will produce an imortant and telling pivot point for the market. Start bracing now as the coming week could be a race against all the “quiet” breakdowns in the stock market.
Full disclosure: long UVXY call options, long SNAP, long QSR
Follow Dr. Duru’s commentary on financial markets via more


