
Above The 40 – A Quiet Bearish Divergence Out Of Overbought Territory
AT40 = 69.9% of stocks are trading above their respective 40-day moving averages (DMAs) – ended 12 straight days overbought
AT200 = 59.7% of stocks are trading above their respective 200DMAs
VIX = 9.9
Short-term Trading Call: bullish (see caveats below)
Commentary
AT40 (T2108), the percentage of stocks trading above their respective 40-day moving averages (DMAs), slipped below the overbought threshold at 70%. The overbought period ended at 12 days. Yet, the trading action in general did not confirm the bearish implications of this drop.
The S&P 500 (SPY) and the Nasdaq printed a new marginal all-time high. Largely thanks to Apple (AAPL), the PowerShares QQQ ETF (QQQ) gapped up to a new all-time high with a 0.3% gain. Financials continued a strong rebound with a 0.7% gain from the Financial Select Sector SPDR ETF (XLF). From these moves alone, I would have guessed that the stock market is ready leave its drift behind and begin a fresh lift-off.
Small caps in the form of the iShares Russell 2000 ETF (IWM) slipped ever so slightly, but the move hardly qualified as a source of alarm. The Energy Select Sector SPDR ETF (XLE) faded from its highs to gain 0.2%. The smallest hint of trouble came from the volatility index, the VIX, which actually managed to hold onto the gain from a gap up to 9.9. Still, this move was well within the realm of noise.
The retail sector provided some truly bearish news, but SPDR S&P Retail ETF (XRT) has been in a bearish mood for most of 2017. Last week, XRT confirmed resistance at its 200DMA and today confirmed 50DMA resistance with a lower close since last Thursday’s breakdown.
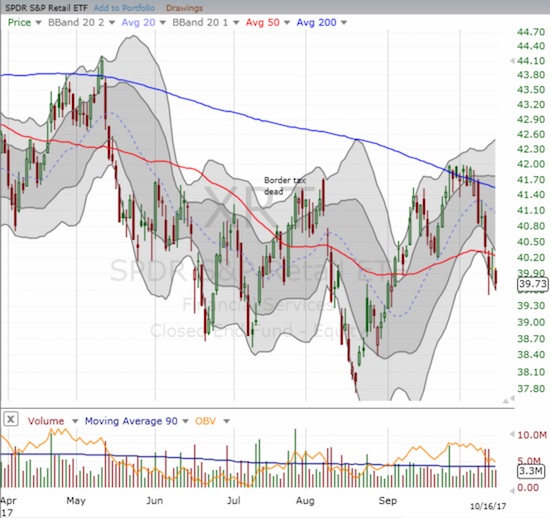
The SPDR S&P Retail ETF (XRT) is back to confirming its bearish momentum for 2017.
So while AT40 formed a bearish divergence from the market, I think the move was far too subtle to ring my alarm bells. However, if the S&P 500 closes below the previous breakout on October 5th (below 2540) while AT40 continues to descend, then I will at least switch the trading call to cautiously bullish. Until then, I am keeping the bias on bullish and am looking for AT40 to quickly return to overbought territory.
As a reminder, given earnings season is in full swing, market conditions and technicals can change on a dime!
STOCK CHART REVIEWS
If I only had the chart of Apple (AAPL), I would not have guessed that the market’s technicals took a potentially bearish turn.
Presumably helped by an upgrade, Monday proved magical for AAPL once again. The stock gained 1.8% after gapping up and over 50DMA resistance. This breakout confirmed support from the bottom of August’s post-earnings gap up. AAPL neatly tested this support last month.
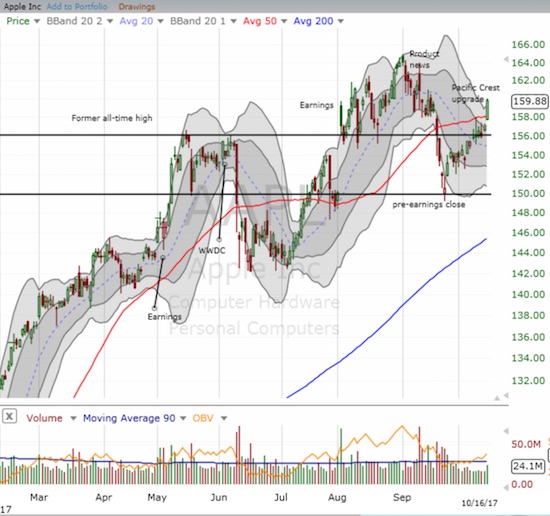
Apple (AAPL) broke out on a small increase in trading volume.
Caterpillar (CAT)
CAT is one of my favorite indicators for market bullishness. Like AAPL, CAT alone tells me the market is back to lift-off mode. CAT gained 0.6% and closed above its upper-Bollinger Band (BB) for the second day in a row.
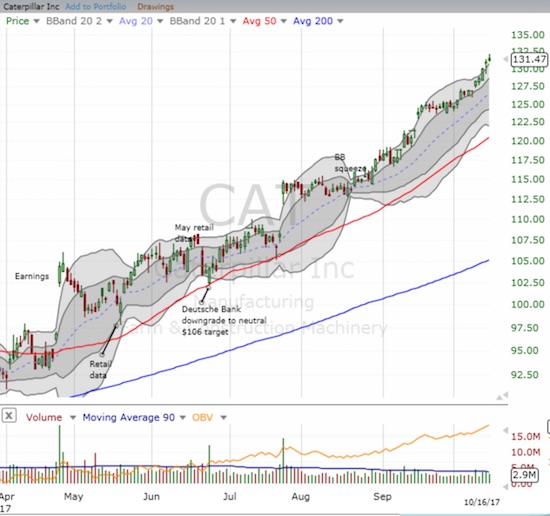
It is hard to find a chart more bullish than Caterpillar’s (CAT) recent momentum.
iShares MSCI Turkey ETF (TUR)
You can’t make this stuff up…buyers stepped into the sell-off in TUR right at 200DMA support. A picture-perfect bounce quickly erased the losses driven by a fresh diplomatic dispute between the U.S. and Turkey.
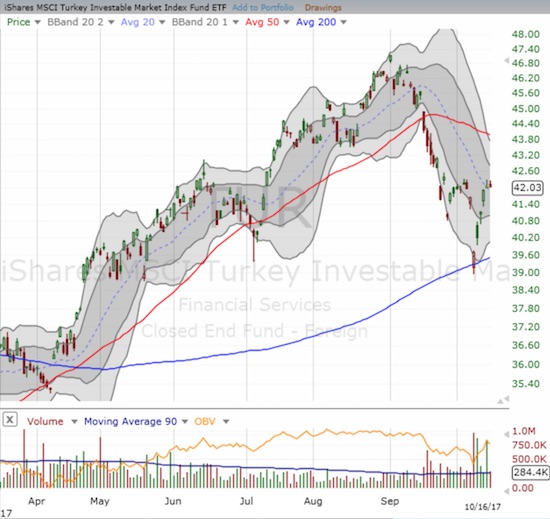
The iShares MSCI Turkey ETF (TUR) delivered a picture-perfect test of 200DMA support.
“Above the 40” uses the percentage of stocks trading above their respective 40-day moving averages (DMAs) to assess the technical health of the stock market and to identify extremes in market sentiment that are likely to reverse. Abbreviated as AT40, Above the 40 is an alternative label for “T2108” which was created by Worden. Learn more about T2108 on my T2108 Resource Page. AT200, or T2107, measures the percentage of stocks trading above their respective 200DMAs.
Active AT40 (T2108) periods: Day #413 over 20%, Day #227 over 30%, Day #27 over 40%, Day #26 over 50%, Day #22 over 60%, Day #1 under 70% (ending 12 days over 70% and overbought)
Daily AT40 (T2108)

Black line: AT40 (T2108) (% measured on the right)
Red line: Overbought threshold (70%); Blue line: Oversold threshold (20%)
Weekly AT40 (T2108)

Disclosure: Long UVXY calls, long AAPL call option.
Follow Dr. Duru’s commentary on financial markets via more


