
Above The 40 – A Growing Undertow For The Stock Market
AT40 = 48.9% of stocks are trading above their respective 40-day moving averages (DMAs)
AT200 = 63.5% of stocks are trading above their respective 200DMAs
VIX = 11.5 (volatility index)
Short-term Trading Call: neutral
Commentary
Market weakness continued to grow yesterday even as the major indices barely notched losses on the day. AT40 (T2108), the percentage of stocks trading above their respective 40-day moving averages (DMAs), did something it has not done in 79 trading days: it closed below 50%. AT40 has now erased all but four trading days of post-election gains.
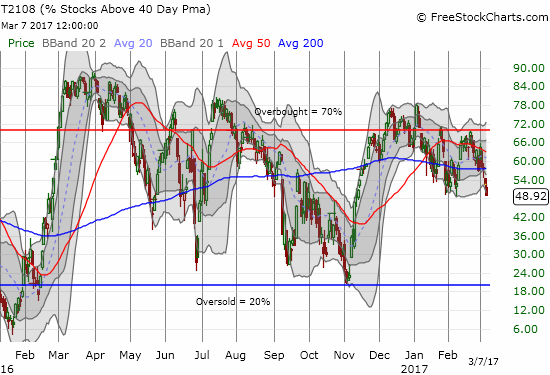
AT40 (T2108) close at a level last seen shortly after the November U.S. Presidential election.
Without AT40, the current marginal declines in the major indices would look completely harmless. Instead, my alarm bells are ringing incrementally louder. Yet, I STILL cannot flip bearish because the S&P 500 (SPY) easily avoided closing below the low of the trading day before its last bullish breakout (2359). Note that both the S&P 500 and the NASDAQ (QQQ) are (marginally) trading below their respective uptrends defined by their upper-Bollinger Bands (BBs).
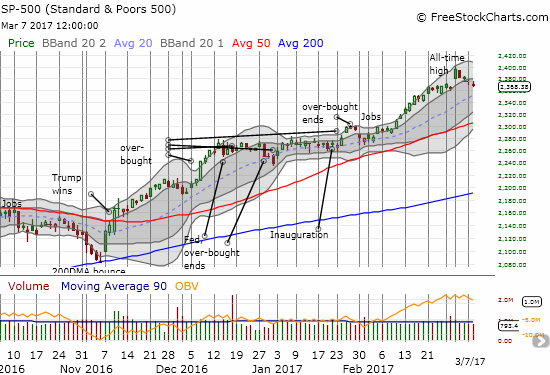
The S&P 500 is orderly drifting into last week’s gap up.
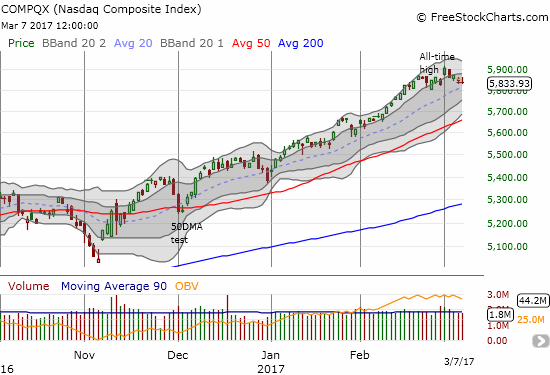
The Nasdaq is heading toward its uptrending 20DMA support – something the tech-laden index has not done since the beginning of the year.
The volatility index, the VIX, is also showing next to no signs of stress.
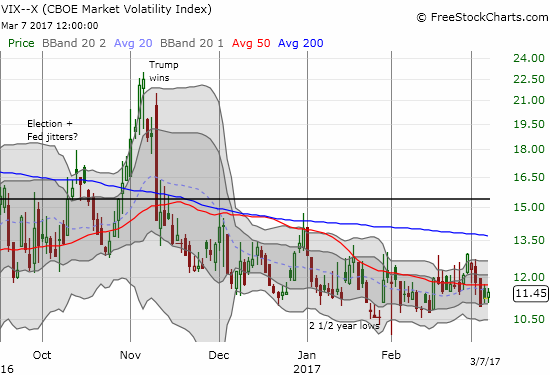
The volatility index gained 1.9% on the day as it barely acknowledged any stress on the day.
Perhaps the most critical test that appeared at the end of the day happened for small-caps. The iShares Russell 2000 (IWM) closed at its low of the day…right on top of support at its 50DMA. Granted, multiple 50DMA breakdowns starting a little over a month ago failed to generate follow-through selling.
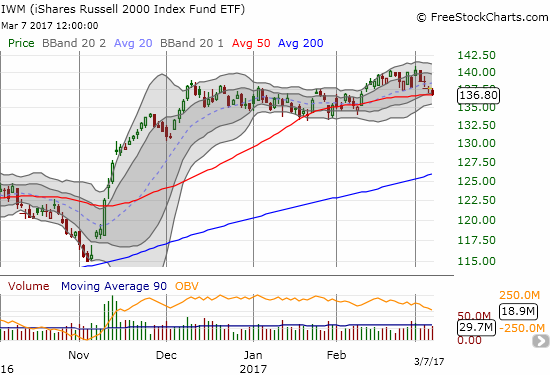
The iShares Russell 2000 closed right on top of 50DMA support.
While the growing bearish signals have made me more and more wary, I continue to look out for bullish (swing) trading opportunities. I found two in somewhat surprising places.
I last discussed Restaurant Brands International Inc. (QSR) as the short-end of a successful pairs trade with Popeyes Louisiana Kitchen (PLKI) where timing turned out to be everything. QSR has closed its last gap up with two very favorable characteristics: 1) declining trading (selling) volume, and 2) a perch right on top of uptrending support at its 20DMA. I typically would wait for confirmation of the buying opportunity with a solid up day on good volume, but I decided to step in given the stock’s earlier momentum. Next support form here would be around $52.
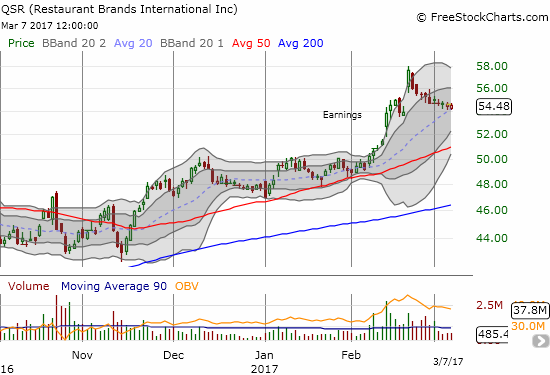
Restaurant Brands International Inc. is potentially setting up for its next leg higher as it gently kisses 20DMA support.
It is day number four of trading for SNAP, Inc. (SNAP), and the daily drama is alive and well. As a result, my trading strategy for SNAP has become more fluid than I expected.
Covered $SNAP near the open. Figured a 10% gap down is pretty bad. Can't get much worse for the day? Looking for new entry. #122trade
— Dr. Duru (@DrDuru) March 7, 2017
The panic and pessimism has reached what I think are near crescendo levels. I now think there is little coincidence in SNAP’s inability to maintain manic buying while AT40 steadily weakens. Yet, while I think SNAP is still over-valued, I also think that the decline from the intraday high set on day #2 of $29.44 has occurred “too much, too fast.” The moment to test my thinking and take off the bear suit long enough to play a bounce came after 2:30 when a relatively high volume surge took SNAP to a fresh all-time low: it had the sign of a wash-out given the stock was then down over 10% on the day. With an eye on Needham’s price target of $19 to $23, I decided that $20.75 was “close enough” to a decent risk/reward spot for a swing trade. SNAP happened to rally soon after and closed right at the next level of intraday resistance: the stock failed to crack $21.50 several times through the day.
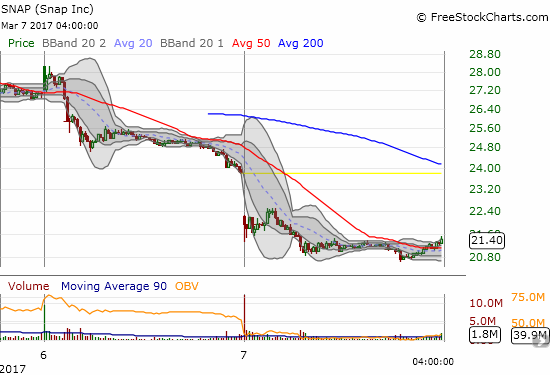
Snap Inc. swooned for the second straight day – this time for a 9.8% loss. Unlike Day #3 of trading, buyers stepped into the stock going into the close.
SNAP’s behavior for day #4 was different in that the day started on a sour note. Sellers were finally active in the pre-market and forced the stock to gap down below the intraday low from Day #1. The 5-minute chart above shows buyers tried valiantly to lift SNAP out of the trough, but they quickly failed. That failure set the tone for the rest of the day. Accordingly, market sentiment has once again soared on SNAP. All but the lucky institutions who got in on SNAP’s IPO at $17/share are sitting on losses.
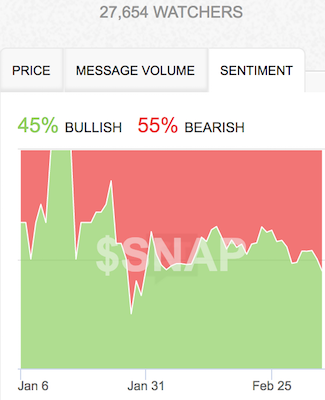
Sentiment continued to chase price as bearish sentiment jumped from 50% to 55%.
Source: StockTwits.com
Video length: 00:01:54
The next test of my willingness to buy may come from Cognizant Technology (CTSH). Last week, I outlined the case for buying the dips on CTSH…and here is a dip. Support at the 50DMA looms…
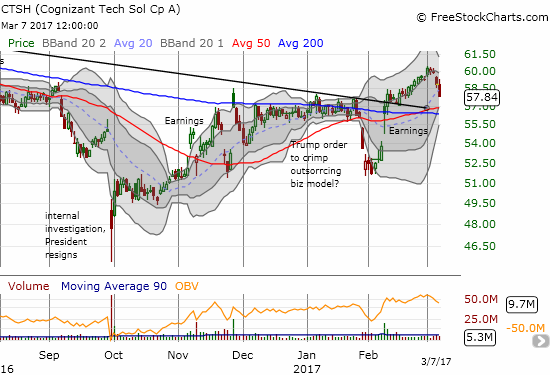
Cognizant Technology has almost erased four weeks of gains in just two days. Support at its 50DMA or 200DMA needs to hold.
“Above the 40” uses the percentage of stocks trading above their respective 40-day moving averages (DMAs) to assess the technical health of the stock market and to identify extremes in market sentiment that are likely to reverse. Abbreviated as AT40, Above the 40 is an alternative label for “T2108” which was created by Worden. Learn more about T2108 on my T2108 Resource Page. AT200, or T2107, measures the percentage of stocks trading above their respective 200DMAs.
Active AT40 (T2108) periods: Day #263 over 20%, Day #83 over 30%, Day #82 over 40%, Day #1 under 50% (ending 79 days over 50%, underperiod), Day #4 under 60% (underperiod), Day #29 under 70%
Daily AT40 (T2108)

Black line: AT40 (T2108) (% measured on the right)
Red line: Overbought threshold (70%); Blue line: Oversold threshold (20%)
Weekly AT40 (T2108)

*
All charts created using freestockcharts.com unless otherwise stated
The charts above are my LATEST updates independent of the date of this given AT40 post. For my latest AT40 post click here.
Related links:
The T2108 Resource Page
You can follow real-time T2108 commentary on twitter using the #T2108 or #AT40 hashtags. T2108-related trades and other trades are occasionally posted on twitter using the #120trade hashtag.
Full disclosure: long UVXY call options, long SNAP, long QSR
Follow Dr. Duru’s commentary on financial markets via more


