
Above The 40 – A Fed Buzzkill Ends Ambitions For An Overbought Market
AT40 = 66.1% of stocks are trading above their respective 40-day moving averages (DMAs) (ended 1-day overbought)
AT200 = 55.5% of stocks are trading above their respective 200DMAs (a 4-month high)
VIX = 12.9
Short-term Trading Call: bearish
Commentary
Flipping short-term bullish was fun while it lasted…all of two days.
The Federal Reserve hiked interest rates another 25 basis points to 1.75-2.00%. This move was well anticipated by the market. The hawkishness of the Fed’s statement and posturing was perhaps NOT so well anticipated. The market changed very quickly from anticipating just one more rate hike for 2018 to two; this adjustment matches the change in the Fed’s “dot plot” of rate expectations of individual board members. The odds for two more rate hikes by December soared from 45.8% to 56.5% (these odds increased 1% over the time it took me to write this piece).
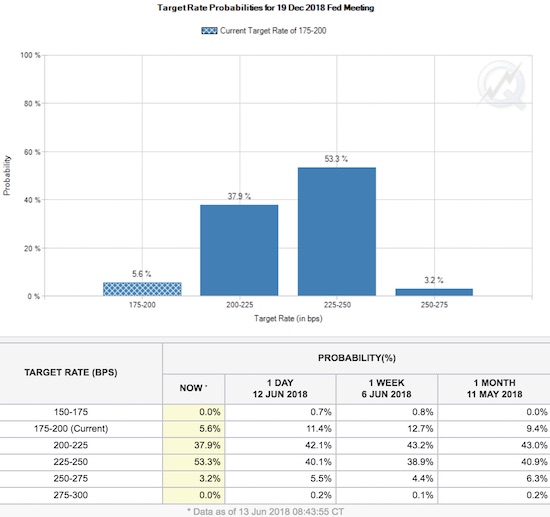
Adding from left to right, starting from the 225-250bps target range, the market tells us that it thinks there is a 56.5% chance that December will deliver the 4th rate hike of 2018. This is a large leap from the previous day at 45.8%.
Source: CME FedWatch
This move is important because the S&P 500 (SPY) has had such a poor record in 2018 following Fed meetings. So while the 0.4% loss seems minor, it is a Fed-driven buzzkill given the context. Note well in the chart below that the index stopped cold at resistance from the February-March double peak.
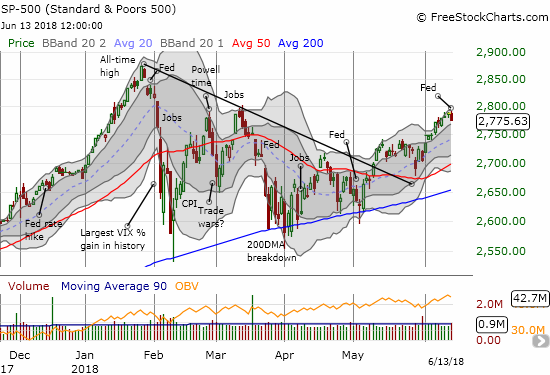
The S&P 500 (SPY) stopped cold at would could turn out to be stiff resistance. It is still in the middle of an uptrending upper-Bollinger Band (BB) channel.
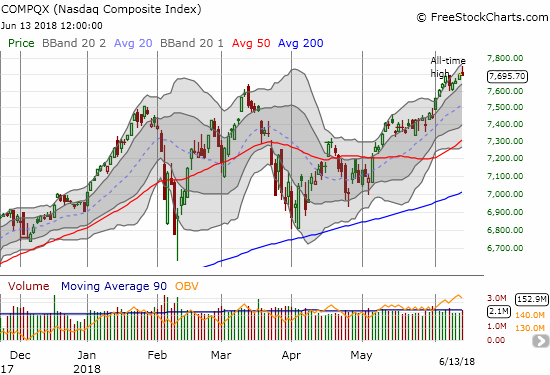
The Nasdaq faded from a fresh all-time high to close with a minimal 0.1% loss.
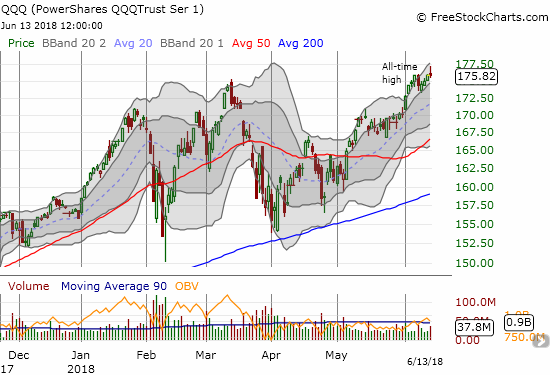
The PowerShares QQQ ETF (QQQ) pulled back from a fresh all-time and the upper bound of its upper-Bollinger Band (BB) channel to close flat on the day.
AT40 (T2108), the percentage of stocks trading above their respective 40-day moving averages (DMAs), dropped hard out of overbought territory (above 70%) to close at 66.1%.
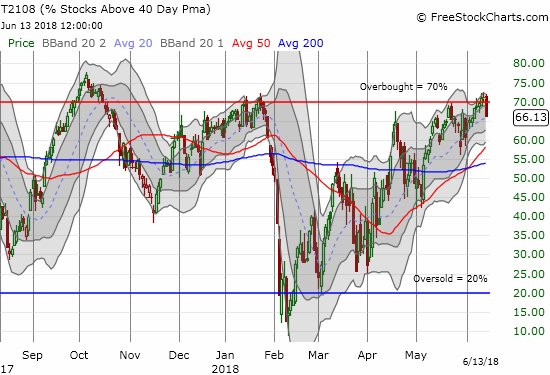
AT40 (T2108) fell from overbought status. If AT40 is still trending upward, then this pullback needs to end quickly. Otherwise, the market could be in for a notable pullback.
As I explained in my last Above the 40, I saw all sorts of bullish evidence that traders were gearing up to scoop up beaten down stocks as part of an effort to play catch-up with a market that looked ready for an extended overbought run. Maybe that move can still happen, but I suspect the market now needs a rest.
Per rule, I have flipped my short-term trading call all the way to bearish as a result of AT40 falling from overbought territory. I make this downgrade reluctantly because I recognize scenarios by which the market could churn right back into overbought territory. For example, the U.S. dollar index (DXY) surprisingly pulled back. Perhaps traders are preparing for a euro-bullish announcement from the European Central Bank (ECB)? If the dollar continues to fall it could provide enough of a tailwind to the stock market to ignore the hawkish Fed.
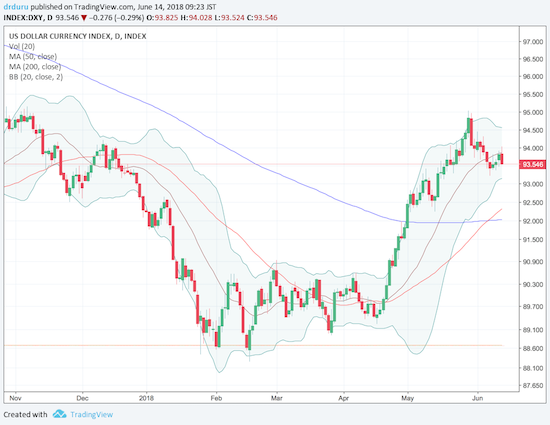
The U.S. dollar index (DXY) took a post-Fed dip. Is the 20DMA turning into resistance?
Source: TradingView.com
The volatility index, the VIX, increased slightly but nowhere near an amount the suggests a fresh sense of alarm or fear in the market.
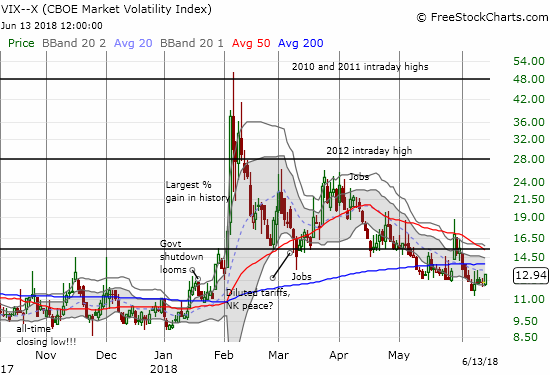
The volatility index, the VIX, only gained 4.9%. The VIX has likely bottomed for now, but it is hard to say whether sellers have enough motivation to send the VIX much higher.
Longer-term rates did not move enough to suggest they could cause a new headwind to the market. The iShares 20+ Year Treasury Bond ETF (TLT) was essentially flat for the day and still far above recent lows.
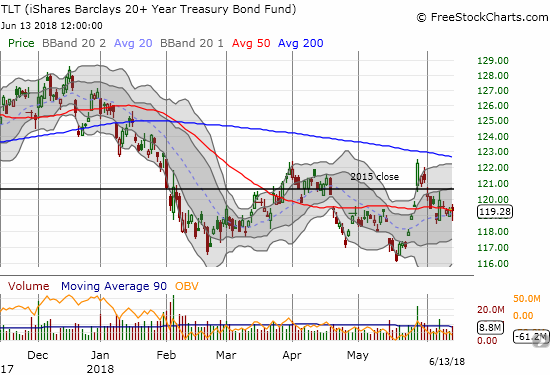
The iShares 20+ Year Treasury Bond ETF (TLT) bounced-off its low for the day to close flat. The 50DMA may be turning into a pivot.
While this mix of signals does not suggest a strong flip from bullish to bearish conditions, I am most concerned with the combination of falling from overbought at the same time the S&P 500 pulled back post-Fed. This same combination was part of the launch of the February swoon. Note well that I expect at worst a short-term pullback to 50DMA support for the S&P 500. I already have call options on ProShares Ultra VIX Short-Term Futures (UVXY). I will dip my toe in more bearishness with put options on SPY. From there, I will only add to bearish positions with further confirmation of bearish signals…again, I remain wary of yet more churn.
Video Length: 00:52:22
CHART REVIEWS
iShares US Home Construction ETF (ITB)
Home builders provided the most definitive sign of a Fed-driven change in market sentiment. ITB lost 3.7% and closed under its 200DMA. Trading volume was double the 90-day moving average; this high activity confirmed the determination of sellers to weigh on the sector all over again and snuffed out much of the flicker of life I described in the last Housing Market Review. The pullback gave me a chance to implement the plan I described earlier to trade the breakouts in Pulte Homes (PHM) and Meritage Homes (MTH); I placed these orders before recognizing the bearish shift in the entire market. An upward turn in its 20 and 50DMAs are the remaining bright spots for the technicals in ITB.
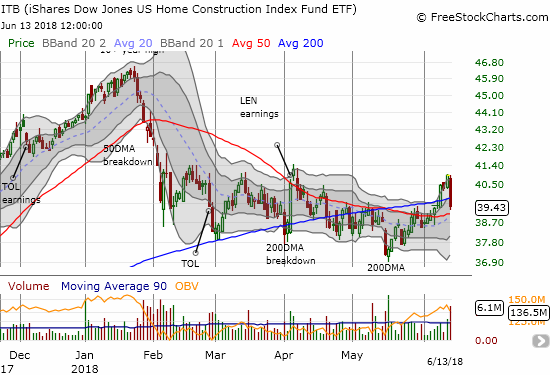
The iShares US Home Construction ETF (ITB) sold-off hard on high volume.
My ears perked up as Fast Money talked once AGAIN about buying Lennar (LEN) for a trade. Some trader(s) loaded up on call options: Jul 55/60 1×2 (ratio) call spread for $0.75, break-even is $57.50 and maximum gain at $60. Recall that the last Fast Money segment on LEN also targeted $60 for the upside of a trade. I am just as unconvinced now as I was then. At least if LEN DOES manage to revive itself, it should be part of a sector move that helps my other trades.
Video Length: 00:01:16
As homebuilders get wrecked, one trader is betting on a big rebound for Lennar from CNBC.
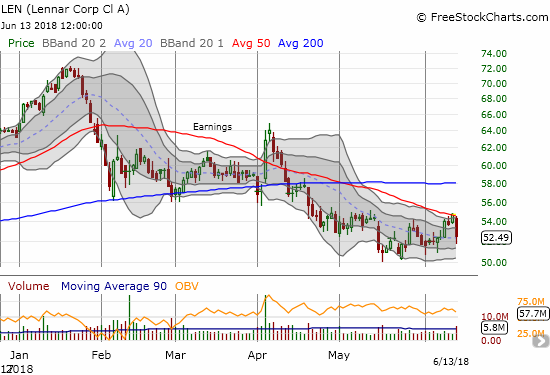
Lennar (LEN) lost a whopping 4.0% as a downward trending 50DMA provided stiff resistance.
Apple (AAPL)
AAPL lost 0.8% and pretty much ended my chances for a positive turn on this week’s AAPL call option trade. Before, the stock look poised to fill last week’s gap down. AAPL’s sag could be the market’s drag that prevents a return to overbought status.
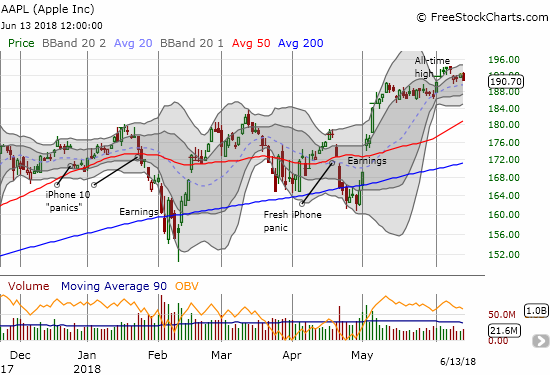
The loss in Apple (AAPL) officially ends the bullish resolution to the Bollinger Band (BB) squeeze. Looks like a lot of churn ahead.
“Above the 40” uses the percentage of stocks trading above their respective 40-day moving averages (DMAs) to assess the technical health of the stock market and to identify extremes in market sentiment that are likely to reverse. Abbreviated as AT40, Above the 40 is an alternative label for “T2108” which was created by Worden. Learn more about T2108 on my T2108 Resource Page. AT200, or T2107, measures the percentage of stocks trading above their respective 200DMAs.
Active AT40 (T2108) periods: Day #81 over 20%, Day #50 over 30%, Day #45 over 40%, Day #27 over 50%, Day #10 over 60% (overperiod), Day #1 under 70% (underperiod ending 2 days over 70%)
Daily AT40 (T2108)

Black line: AT40 (T2108) (% measured on the right)
Red line: Overbought threshold (70%); Blue line: Oversold threshold (20%)
Weekly AT40 (T2108)

Disclosure: Long UVXY calls, long TLT puts, long and short various currency pairs with the U.S. dollar, long AAPL calls, long ITB calendar call spread.
Follow Dr. Duru’s commentary on ...
more

