
A Purrrfect Gold Price Setup!
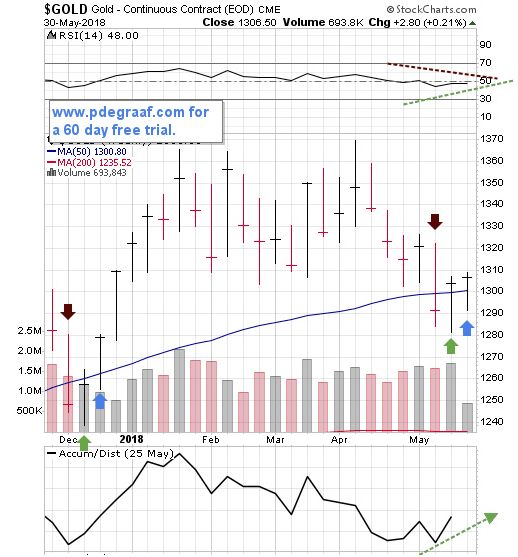
Featured is the weekly gold chart. The green arrows point to ‘upside reversals’, developing after price dropped below the 50WMA. The blue arrows point to a positive follow-through, following an upside reversal. A similar situation back in December enabled gold to rise for 5 out of 6 weeks! The current rise has the potential to jump above the $1365 resistance area with a target at $1395. The RSI is neutral, but the A/D line is positive.

Featured is a longer-term gold chart. The pattern is a bullish inverted 'head and shoulders' formation (green blocks). A breakout at the blue arrow sets up a target at the green arrow. The RSI is at support and the A/D line is rising. The moving averages are in positive alignment (green oval), and the 50WMA (blue line) is rising.
(Charts courtesy Stockcharts.com)
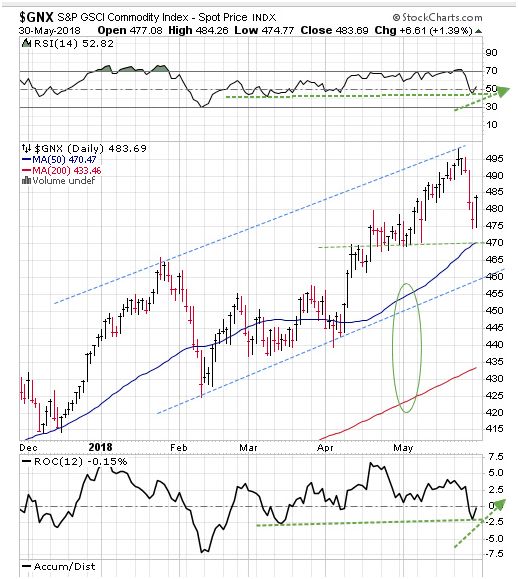
Featured is GNX the commodity index. Price is rising inside the blue channel. A short-term pullback from overbought conditions is coming to an end. The supporting indicators are ready to rise up from support levels. The moving averages are in positive alignment and rising, (green oval). This uptrend supports the entire commodity complex, including the precious metals sector.
Peter Degraaf is an investor with over 50 years of experience. He sends out daily reports to his many subscribers. Google him or visit more


