
A New Bull Market In Commodities Is Emerging
We’ve all watched in amazement while the equities markets around the world have risen to new highs. On Wall Street hardly a week goes by without a new record. There comes a time however when a sector becomes so overbought, that smart money begins to leave and search for a sector that has been overlooked. That moment is now at hand, as can be seen in our first chart – courtesy sources listed.
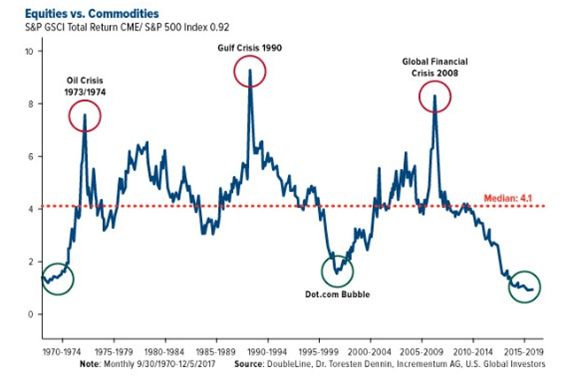
This chart compares equities to commodities. In 1970, 2000 and today, equities have become overpriced, while commodities are oversold and cheap by comparison. In 1973, 1990 and 2008, oil and commodities became overbought and investors sold commodities and bought stocks. If history repeats (and it often does), we are about to witness a massive switching from equities into commodities. This trend may or may not include oil, since it is already in a bull market, but because of ongoing demand in Asia it will include such items as natural gas, copper, lithium, vanadium, zinc, and cobalt, and the stocks of the companies that mine and produce these commodities will be in great demand.
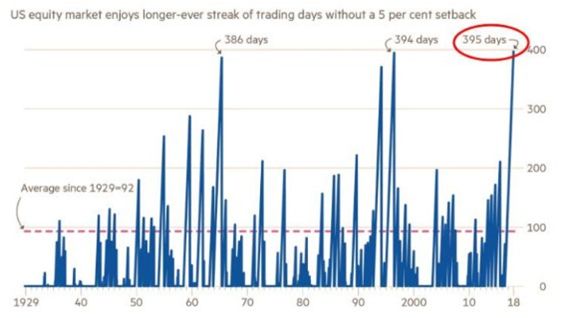
This chart courtesy ZeroHedge.com shows the average number of days in the US stock market between occasions where the index drops 5% or more is 92 days, all the way back to 1929. In the mid-1960s there was a stretch without a 5% correction for 386 days. In the mid 1990s the index went 394 days without a 5% correction. And now (as of Thursday Jan 25th) we have gone a record 399 days without a 5% pullback. So The S&P has NEVER been this over-valued, NEVER been this overbought, and NEVER gone this long without even a minor correction. Odds are.....
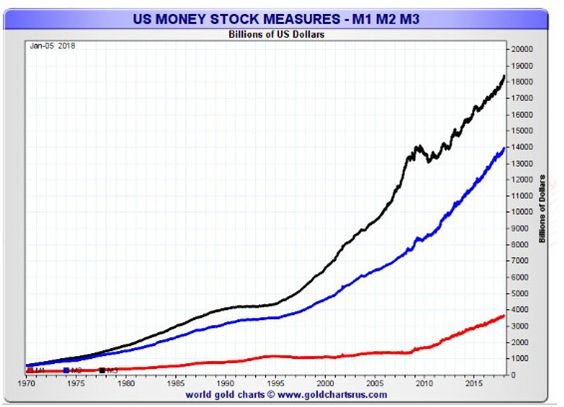
This chart courtesy goldchartsrus.com shows US Money Supply continues to rise, across all measures. This money needs a destination, and with the stock market in bubble territory, a lot of this money is destined for commodities.
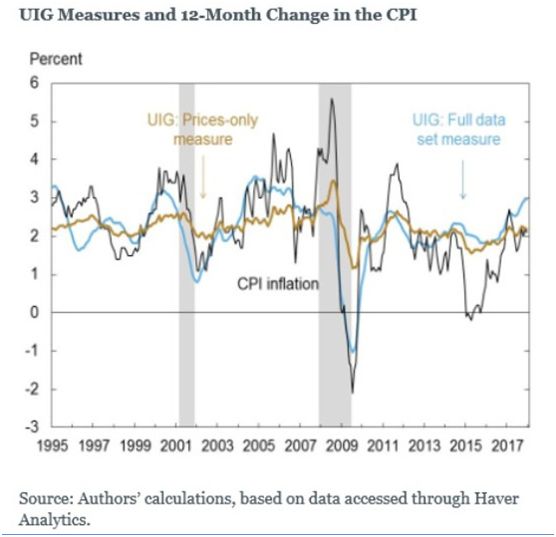
This chart courtesy sources listed shows an inflation gauge that is used by the NY Fed. It is called the Underlying Inflation Gauge, and you can see it here as a light blue line. It is warning that price inflation is underway. The Model Portfolio (which reflects live transactions) is currently ahead by 38% - well above the rate of inflation. It is very important that our investments stay ahead of the rate of inflation.
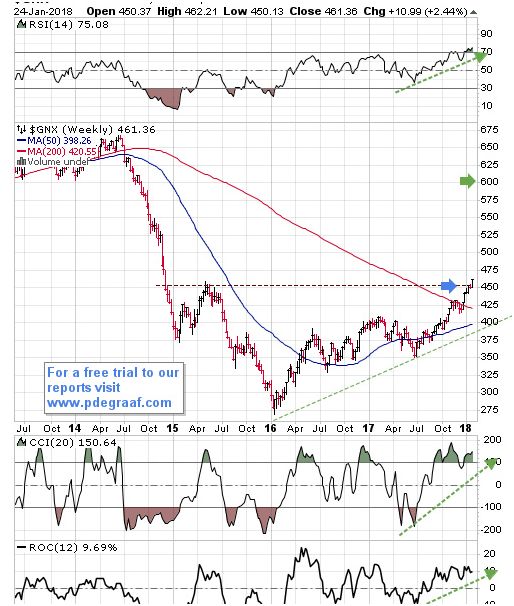
Featured is GNX the commodity index. Price is breaking out above lateral resistance, after already having broken out from beneath the 200WMA. The target for this breakout is at the green arrow. The supporting indicators are positive.
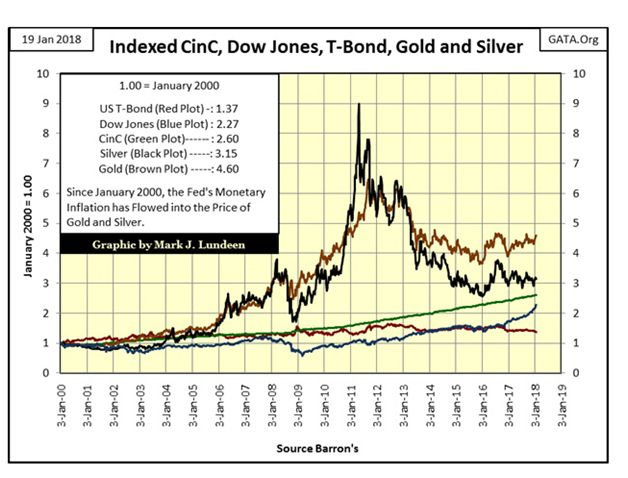
This chart courtesy Mark J. Lundeen will be a surprise to some. It compares US bonds, stocks, silver and gold to currency in circulation. The surprise is that since year 2000, gold has outperformed equities by 4.60 to 2.27. Even silver - in an 18 year span - has outperformed the stock market. It was inflation that propelled gold and silver to rocket higher in the late 1970s. Is history about to repeat? Whenever commodities are in a bull market, gold and silver tend to shine.
Disclaimer: Investing involves risk taking. Please do your own due diligence. Peter Degraaf is NOT responsible for your trading decisions.
Peter Degraaf is a stocks and commodities investor ...
more

