
A Great Second Quarter Report — But Beware The Context
Following up on Jim’s post on the GDP release, here are four observations.
1. GDP Growth Is Good, but Not Spectacular, Either on q/q or y/y basis
Over the past 11-1/2 years, there have been several instances of q/q growth exceeding 4%, and many exceeding 3%, including during the Obama years.
(Click on image to enlarge)
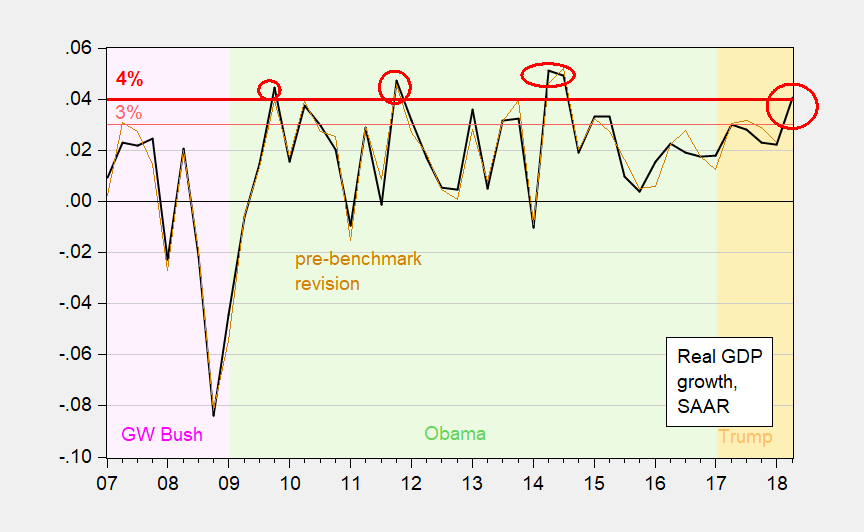
Figure 1: Quarter on quarter annualized GDP growth, from pre-annual revision (brown), and from 2018Q2 advance release (bold black). Horizontal red line at 3% growth, horizontal bold red line at 4%. Instance of growth in excess of 4% using latest series circled red. GW Bush administration shaded light pink, Obama light green, Trump light orange. Source: BEA.
Indeed, over the Great Moderation (1986 onward), we’ve seen many instances of over 4% q/q growth, as shown in the below histogram.
(Click on image to enlarge)
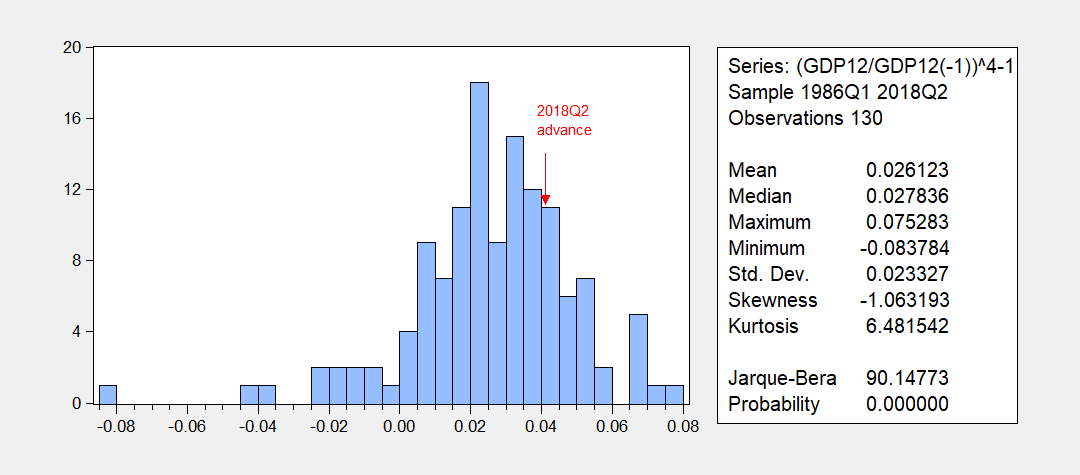
Figure 2: Histogram of annualized quarter-on-quarter GDP growth, 1986-2018Q2. Red arrow at advance estimate of 2018Q2 q/q growth rate. Source: BEA, author’s calculations.
On a year-on-year basis, there were several instances of growth exceeding 3% over the past decade-plus, including during the Obama years.
(Click on image to enlarge)
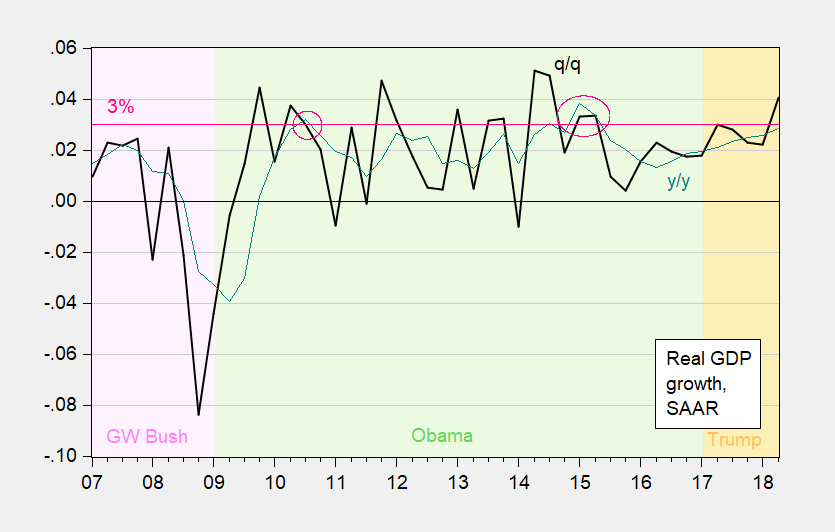
Figure 3: Year-on-year growth rate of quarterly GDP (teal), and quarter-on-quarter annualized growth rate (bold black). Horizontal red line at 3% year-on-year growth. Instance of growth in excess of 3% using latest series circled red. GW Bush administration shaded light pink, Obama light green, Trump light orange. Source: BEA.
Note that even with this growth surge in 2018Q2, growth under Trump has not yet breached 3% on a quarterly y/y basis…
2. Mnuchin’s 3% Growth over Years Is Daring (For the Nondelusional)
The Mnuchin prediction of growth in excess of 3% for several years is actually in the Administration’s forecast. One can see how much of a divergence there is between the Troika (CEA-OMB-Treasury) and CBO (April) projections in the figure below.
(Click on image to enlarge)
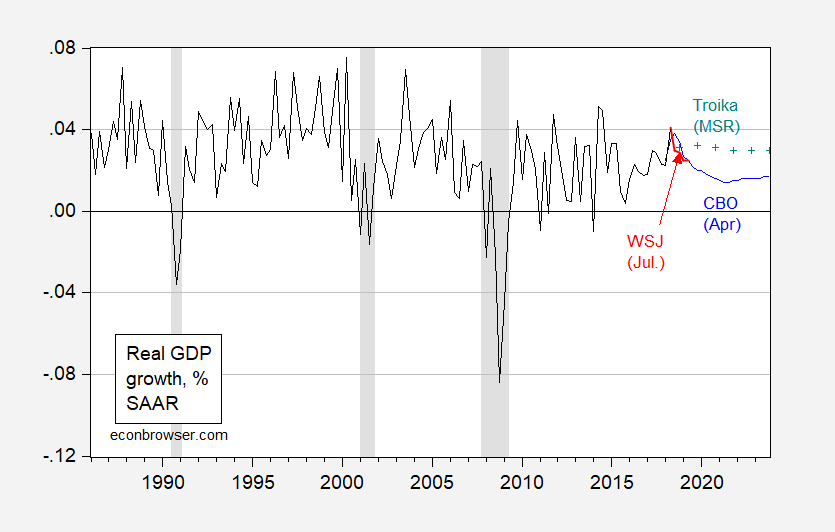
Figure 4: Real GDP q/q annualized growth (black), Wall Street Journal July 2018 survey mean forecast (red), Administration projection (teal +) and CBO (blue). NBER defined recession dates shaded gray. Source: BEA, WSJ, OMB, Table 2, CBO, NBER, and author’s calculations.
The Administration scenario was dubious when I last looked at in April. It still is.
3. Industrial Equipment and Transportation Equipment Investment Are Down
Total fixed investment is up, as is total nonresidential investment. So too are computer and information technology investment. One could worry a little if one thought the housing sector were a leading indicator (à la Leamer), since residential investment is down.
However, if one were to look at where one might think investment related to the tradables sector (e.g., manufacturing) were to be showing effects from trade policy uncertainties, one might think of industrial and transportation equipment. Both are down, but the former more profoundly: 5.6% q/q at an annualized rate.
(Click on image to enlarge)
![]()
Figure 5: Investment in industrial equipment (blue) and transportation equipment, in billions Ch.2012$, SAAR, on log scale. Source: BEA 2018Q2 advance release, Table 1.5.6, expanded detail.
To the extent that investment is a forward-looking indicator, and susceptible to economic and policy uncertainty, this series does not augur well for the sustainability of the growth spurt.
4. Beware Extrapolation: How Did Things Look on the Eve of the Financial Crisis?
It’s important to remember that measurement of an economy as complex as that of the United States is challenging. There is a continuous stream of incoming data which eventuates — sometimes substantial — revisions. For instance, as of September 26, 2008, 2nd quarter GDP q/q growth had recorded a respectable 2.8% annualized rate. Even after the Lehman collapse, the October WSJ forecast for Q4 q/q growth was -1.2%. As of October 30, 2008, the 3rd quarter growth advance estimate was for -0.2% annualized growth rate. In the end (as of the last annual revision), 3rd quarter growth was -2.1%.
(Click on image to enlarge)
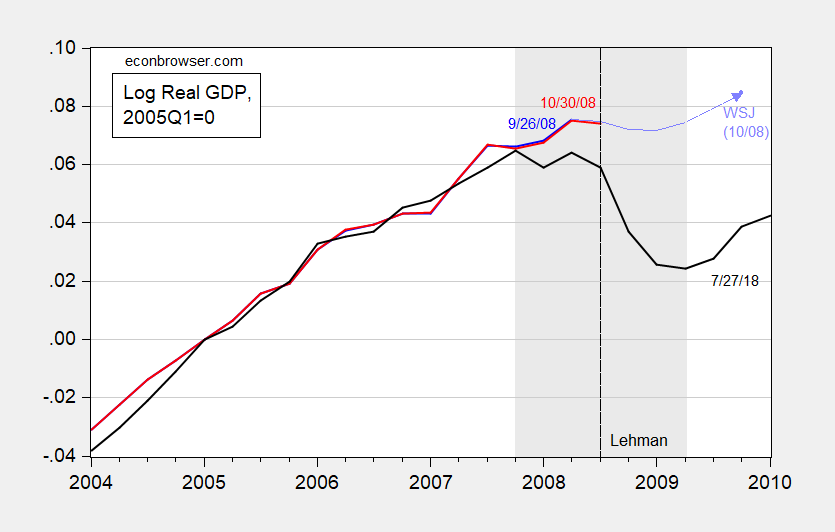
Figure 5: Log real GDP as of 9/26/2008 (blue), as of 10/30/2008 (red), as of 7/27/2018 (black bold), and WSJ Oct 2008 survey mean forecast (light blue), all normalized to 2005Q1=0. NBER defined recession dates shaded gray. Source: BEA, various vintages, WSJ October 2008 survey, NBER, and author’s calculations.
(Click on image to enlarge)
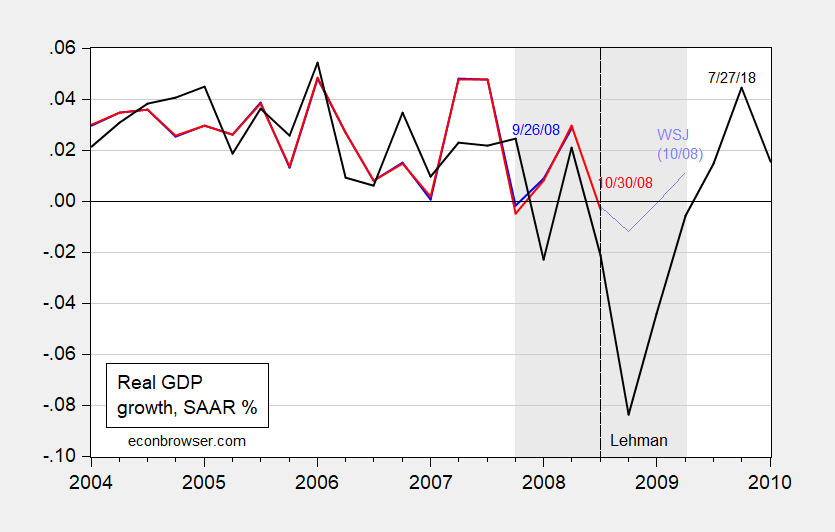
Figure 6: Quarter-on-quarter real GDP as of 9/26/2008 (blue), as of 10/30/2008 (red), as of 7/27/2018 (black bold), and WSJ Oct 2008 survey mean forecast (light blue). NBER defined recession dates shaded gray. Source: BEA, various vintages, WSJ October 2008 survey, NBER, and author’s calculations.
None of the foregoing should be construed as asserting that we are currently in a recession; rather one can creep up much faster than one might think, particularly with the term spreads (10yr-3mo, 10yr-2yr) shrinking. So, rejoice today, for tomorrow… who knows.
Disclosure: None.


#Trump I think wants to get rid of #Menuchin btw..latest tweets..
GDP is only one component..you give it far too much weight imo..it's too much an "interpreted" metric imo..based too much on speculation and politics - always a bad cocktail!