
A Fiscal Tale Of Two States: Minnesota Vs. Wisconsin
The two neighboring states of Wisconsin and Minnesota share a similar economic structure and size; and yet their fortunes have diverged over the past three years. One correlate of Wisconsin’s growth deficit is state and local government spending.
First, let’s document Wisconsin’s lagging performance along three dimensions — gross state product, a high frequency indicator of economic activity from the Philadelphia Fed, and nonfarm payroll employment.
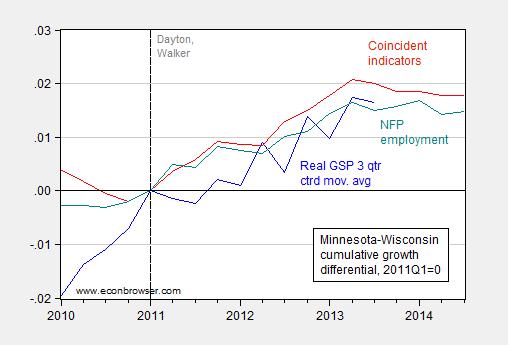
Figure 1: Minnesota-Wisconsin log gross state product cumulative growth differential (3 quarter centered moving average), in Ch.09$ (blue), log coincident indicators (red), and log nonfarm payroll employment (teal), all 2011Q1=0. 2014Q3 observations based on two months. Source: BEA, Philadelphia Fed, FRED, and author’s calculations.
Figure 1 highlights the fact that the growth gap peaked at between 1.6 ppts to 2.1 ppts in the middle of 2013. Interestingly, the gap has only barely diminished since then.
One of the correlates of the Wisconsin lag relative to Minnesota is government spending. Figure 2 illustrates relative cumulative growth in real government spending. Since 2011Q1, Wisconsin’s cumulative real government growth has been 2 percentage points more negative than Minnesota’s.
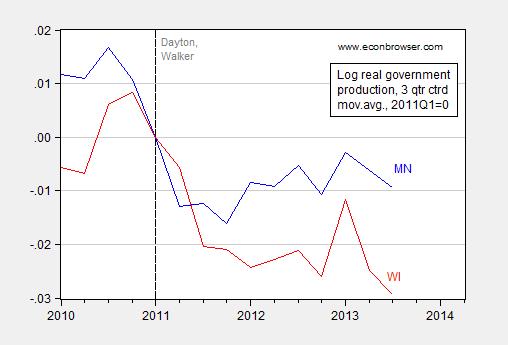
Figure 2: Log real government spending in Minnesota (3 quarter centered moving average) (blue), and in Wisconsin (red), both in bn. Ch.09$, 2011Q1=0. Source: BEA and author’s calculations.
This data ends in 2013Q4, so it’s not clear what’s happened recently. We can glean some information regarding more recent trends from state and local government employment.
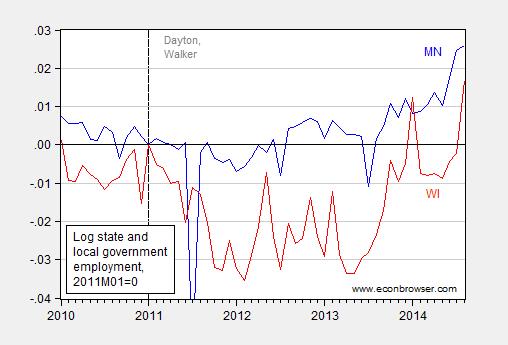
Figure 3: Log state and local employment in Minnesota (blue), and in Wisconsin (red), 2011M01=0. Source: WI DWD, MN DEED, and author’s calculations.
Two observations: (1) as the gap in cumulative government employment growth has closed, the gap in cumulative nonfarm payroll growth has fallen ever so slightly (so too has the private NFP); (2) Wisconsin fiscal policy has become less contractionary in the last year, as state-local employment has risen and the state has embarked on regressive tax cuts [1] [2].
On this last point, I would be tempted to say something about political business cycles, but I will demur. For now, I’ll merely note that lagging Wisconsin performance over the past three years was entirely predictable given standard theory [3] while supply side factors highlighted by Governor Walker were unlikely to have a noticeable effect at that time horizon, if ever.[4] Also entirely predictable, that the Governor’s August 2013 pledge to create 250,000 net new jobs by the end of his first term would not be met, [5] undershooting by over 100,000 according to forecasts from the Walker administration’s own March 2014 Wisconsin Economic Outlook.
Disclosure: None.


