A Different Look At The US Yield Curve
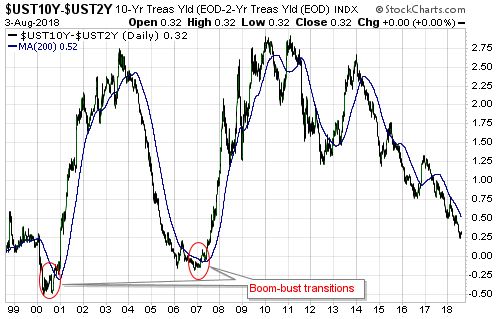
The US yield curve, as indicated by the spread between the 10-year and 2-year T-Note yields, made a new 10-year extreme over the past fortnight, meaning that it recently became the ‘flattest’ it has been in more than 10 years. While this may indicate that the boom is nearing its end, it definitely indicates that the transition from boom to bust has not yet begun.
As explained numerous times in the past, the ‘flattening’ of the yield curve (short-term interest rates rising relative to long-term interest rates) is a characteristic of a monetary-inflation-fueled economic boom. It doesn’t matter how flat the yield curve becomes or even if it becomes inverted, the signal that the boom has ended and that a bust encompassing a recession is about to begin is the reversal of the curve’s major trend from flattening to steepening. To put it another way, the signal that the proverbial chickens are coming home to roost is short-term interest rates peaking RELATIVE TO long-term interest rates and then beginning to decline relative to long-term interest rates. This generally will happen well before the Fed sees a problem and begins to cut its targeted short-term interest rate.
The following chart highlights the last two major reversals of the US yield curve from flattening to steepening. These reversals were confirmed about 6 months prior to the recessions that began in March-2001 and December-2007.
The fact that the yield curve is still hitting new extremes in terms of ‘flatness’ suggests that the next US recession will not begin before 2019.

The above is essentially a repeat of what I’ve written in the past, but an additional point warrants a mention. The additional point is that while it would be almost impossible for the US economy to transition from boom to bust without a timely reversal in the yield curve from flattening to steepening, there is a realistic chance that the next yield-curve trend reversal from flattening to steepening will NOT signal the onset of an economic bust/recession. That’s why I do not depend solely on the yield curve when determining recession probabilities.
The reason that the next yield-curve trend reversal from flattening to steepening will not necessarily signal the onset of an economic bust/recession is that there are two potential drivers of such a reversal. The reversal could be driven by falling short-term interest rates or rising long-term interest rates. If it’s the former it signals a boom-bust transition, but if it’s the latter it signals rising inflation expectations.
As an aside, regardless of whether a major yield-curve reversal from flattening to steepening is driven by the unravelling of an artificial boom or rising inflation expectations, it is bullish for gold. By the same token, a major reversal in the yield curve from steepening to flattening is always bearish for gold.
With the T-Bond likely to strengthen for at least the next two months there is little chance that rising long-term interest rates will drive a yield curve reversal during the third quarter of this year, but it’s something that could happen late this year or during the first half of next year.
Disclosure: None.


