
A "Canary In A Coal Mine" Just Died. Stock Market Beware.
This post involves two very important concepts in anticipating the market’s next move:

1. Relative strength, and
2. Deviations from a norm.
Therefore, this is something you should put into your trading bag of tricks no matter when you read this, but..
If you are reading this on the day it was posted it may prove to be very timely, because the conclusion drawn from this post could be that the market’s current melt up just ‘deviated from what’s normal’ during a melt up.
In other words, a canary in a coal mine just died.
Here’s what happened.
In a normal bullish run in the market, the expected future volatility of the market as measured by the CBOE S&P 500 Volatility Index (VIX) tends to decline. This is because historically the short-term volatility of the market declines as markets rise, and expands when they decline.
This is reflected in the cliché, “market fall faster than they rise”.
The VIX index is tracked by, and therefore can be traded via the ETF VXX. So I’ll use VXX as the focus in the rest of this post.
Given the SPY vs. VIX normal relationship explained above, on bullish days in the market (SPY), the VXX tends to decline or at least be suppressed.
However, as noted in the chart below, on Wednesday, February 15th the markets deviated from the norm in a big way. The VXX traded up and over its 30-minute Opening Range all day and closed near its thigh of the day, on the same day that the S&P 500 and other major stock indexes had the exact same pattern – a strong intra-day move that closed on its highs, and even at all-time record highs.
(Click on image to enlarge)
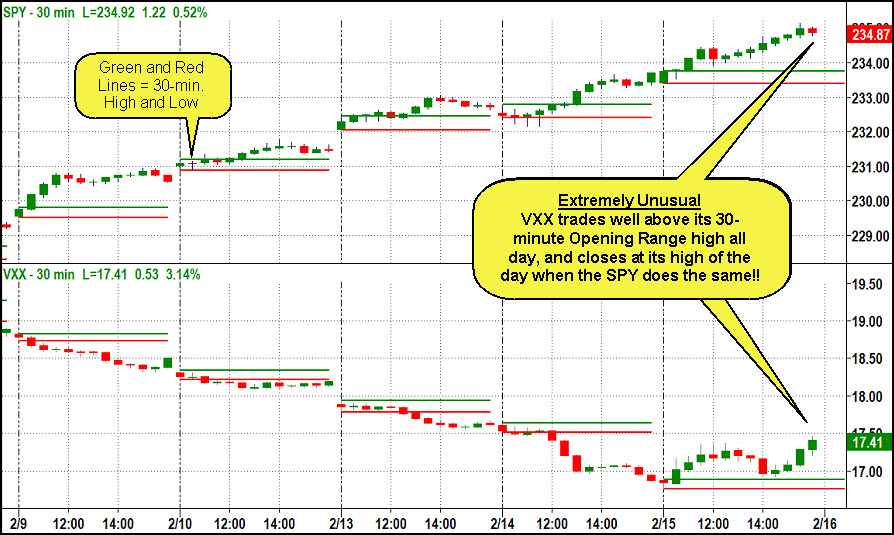
One could argue that VXX is incredibly low, and therefore a bounce is to be expected. This may be true, however, the relative performance of the VXX vs. the SPY was extraordinary, and therefore merits you attention.
What Does This Imply For The Market’s Direction and Trade Opportunities?
I was not able to compile historical statistics on this pattern and the market’s subsequent moves, but I scanned of the last 18 months of chart data and I was not able to find anything comparable!
So this is a “first” which means the market is doing something it has not done in a significant amount of time. Regular readers/viewers of our free and premium content should recognize the importance of this for trading.
Using the basic tactics we use and teach here at MarketGauge I’ll approach this situation as I would any “inflection point” day.
If I consider Wednesday, Feb. 15th an inflection point day in the VXX, then the next step is to watch for the VIX to close over that high. If this happens, especially with and equal and opposite pattern in the market ETFs of SPY, QQQ, and IWM, then it will be an opportunity to trade the VIX to the long side, and lighten up on bullish equity trade, and expect the market to consolidate or correct.
On the other hand, if the VXX and stocks indexes resume their respective longer term trends without triggering the “inflection point” trade opportunity then THERE IS NOTHING TO DO.
The beauty of trading inflection points is you know when to act and when to sit on your hands. In this case, if the VXX moves lower, it’s NOT a better entry price!
If this pattern does play out, I do not consider this a long-term signal of a top, but it’s a very notable short-term warning sign which could be traded in a number of different ways – long VXX, sell stocks, and a host of options strategies.
Remember, the inflection day is an “alert”, the trade opportunity does not occur until the market (both the VXX and the stock indexes) move in the presumed direction.
Coincidentally Keith and I will be hosting a free live training session tonight February 16th about how to profit from “inflection day” like trading patterns.
This VXX pattern is not one we will be discussing, because we’ll focus on patterns that are much more frequent and easier to spot.
However, if you attend the training you’ll learn the same tactics you could use on this VXX condition, as well as the patterns we’ll be focusing on.
Tap here if you’d like to attend tonight.
As a bonus you also get an ebook that will help you with your intra-day timing, and explain why I’m showing you the price action of the VXX relative to its 30 minute opening range!
Wow. I really couldn’t have timed tonight’s training any better with the current market conditions!
If you'd like more information about more


VXX chart has behave very strange at times in the past year. Look at the last three weeks in August when it was dead flat, no spikes, dips or trend. I don't recall another period that long that looked like that.