
A 10% Solution
The 10% Solution
Last week, I asked you to think back to last October. Let's try that exercise again, with slightly different parameters. Imagine you or someone you know had $100,000 to put to work, but was risk averse. In a worst-case scenario, such as a major market correction, they were unwilling to risk a decline of more than 10%. What approach would you have taken?
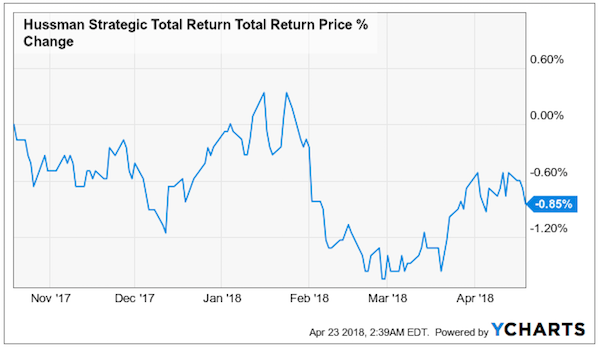
Maybe you would have a conservative fixed income fund such as Hussman Strategic Total Return [HSTRX). If so you would have been down about 0.85% from October 19th to April 19th.
Let's look at what Portfolio Armor would have presented you with then, and see how it did over the next 6 months.
Portfolio Armor's Approach On October 19th
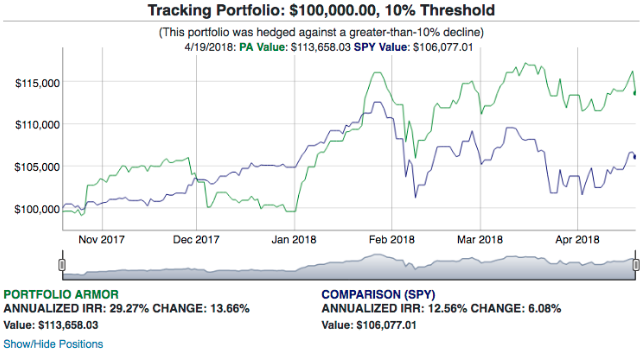
This is the hedged portfolio Portfolio Armor presented on October 19th for an investor with $100,000 who was unwilling to risk a decline of more than 10% over the next 6 months.
The primary securities here were Align Technology (ALGN), Alibaba (BABA), Netflix (NFLX), and Nvidia (NVDA). They were selected because they had the highest potential return estimates, net of hedging costs at the time when hedging against a >10% decline, and they had share prices low enough that you could buy a round lot of one of them for less than $25,000. Weight Watchers (WTW) was added in a fine-tuning step to absorb leftover cash from rounding down to round lots of the first four names.
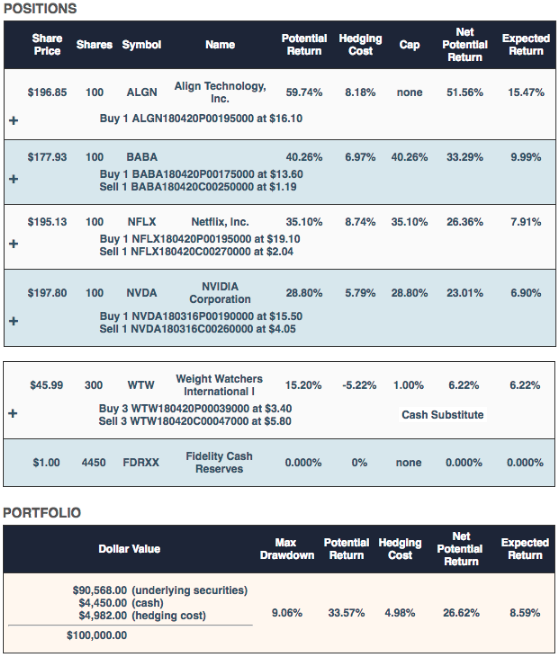
The worst-case scenario for this portfolio was a decline of 9.08% (the "Max Drawdown"), and the best-case scenario was a gain of 26.62% (the "Net Potential Return" or aggregate potential return net of hedging cost). The "Expected Return" of 8.59% was a ballpark estimate taking into account that actual returns, historically, have averaged 0.3x Portfolio Armor's potential return estimates.
We time-stamped this portfolio on Twitter in this tweet a few days later:
$100k Portfolio (Best Potential Return, net of hedging cost versus Risk), 10/19/2017 pic.twitter.com/pEup69MPi1
— Portfolio Armor (@PortfolioArmor) October 23, 2017
How That Portfolio Performed
Here's how the portfolio performed, net of hedging and trading costs, and assuming the hedges were opened at the worst ends of their respective spreads.
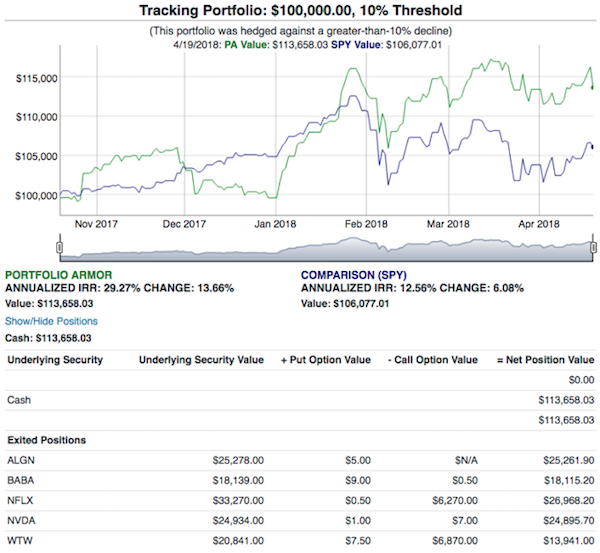
This portfolio returned 13.66%, which outperformed its potential return of 8.59% and outperformed the SPDR S&P 500 ETF (SPY) return of 6.08%.
For an interactive version of the chart above, click here.
Wrapping Up: Smoothing Out Returns
As you can see in the table below, which shows the results of other portfolios created last year that were hedged against >10% declines, there's some variance in returns with this approach.
PORTFOLIOS HEDGED AGAINST > 10.0% DECLINES
| Starting Date | Expected Return | Actual Return | SPY Return |
|---|---|---|---|
| July 7, 2017 | 6.63% | 8.44% | 14.07% |
| August 24, 2017 | 9.18% | 9.97% | 13.72% |
| September 7, 2017 | 6.90% | 5.05% | 11.61% |
| September 28, 2017 | 9.16% | 5.47% | 4.73% |
| September 28, 2017 | 8.81% | 10.35% | 4.73% |
| October 19, 2017 | 8.59% | 13.66% | 6.08% |
| Average | 8.21% | 8.82% | 9.16% |
So a simple way to smooth out your returns would be to split your money into a few tranches and stagger your starting dates by two or three months. Your downside risk would be strictly limited in the same way, but your actual returns would be more in line with your expected returns, as you can see above.


