
20 Strong Dividend Growth Stocks – Rock Solid Ranking
Last year, I created the Rock Solid Ranking, a dynamic stock ranking list that shows a value for each dividend stock I follow. I’ve worked on calculations that consider several metrics in order to find the best companies among all those on the stock market. This list is particularly useful when the stock market is becoming highly valued (not overvalued yet in my opinion).
Each month, I’ll be sharing with you, for free, the top 10 dividend growth stocks for both the US and Canadian markets. You can download your report here: March 2016 Top 20 Rock Solid Ranking
Why Update this list on a monthly basis?
The idea of providing you with an updated top 10 list monthly is to show how metrics and rankings can change from month to month. This becomes highly important during the earnings’ season as lots of new data come out at the same time and it’s hard to digest everything. The updated Rock Solid Ranking gives you a quick view in a few minutes of which companies are best or worst. This printer friendly report stands on a single page with lots of metrics to help you quickly analyze if the company deserves more attention for your next pick.
Out of this top 10 for each stock market, I review 2 companies each month; one US and one Canadian. We start this month with a high yield stock: CALM!
CALM – Cal-Maine Foods
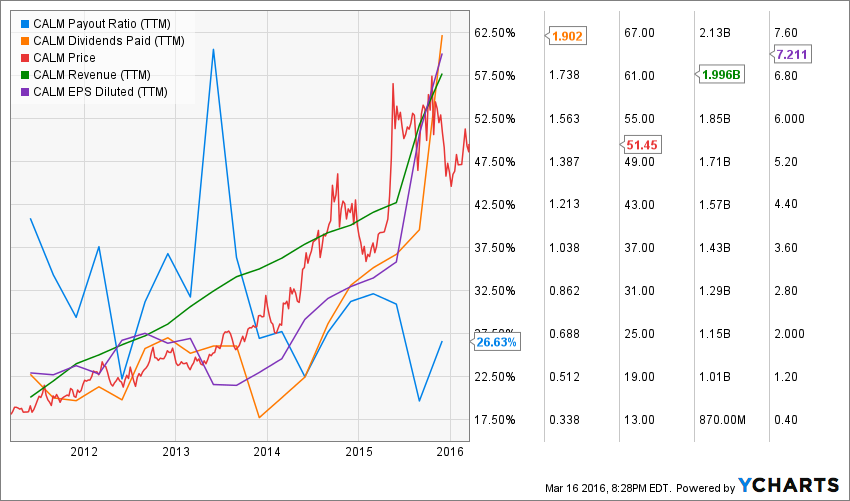
All right, I’ll be honest, I would have never discovered this company if this wasn’t for my rankings! Cal-Maine Foods is a leading producer and supplier of consistently, high quality fresh eggs and egg products in the United States. The company, founded in 1957, is known for growing rapidly through acquisitions. Since 1989, the company has successfully acquired 18 existing egg production and processing facilities. It is a fully integrated egg producer. Cal-Maine sells 90% of its eggs to retail buyers such as Wal-Mart, Costco, Food Lion, etc.
As you can see on the following chart, the egg sector has grown steadily throughout the years offering another growth vector for CALM:
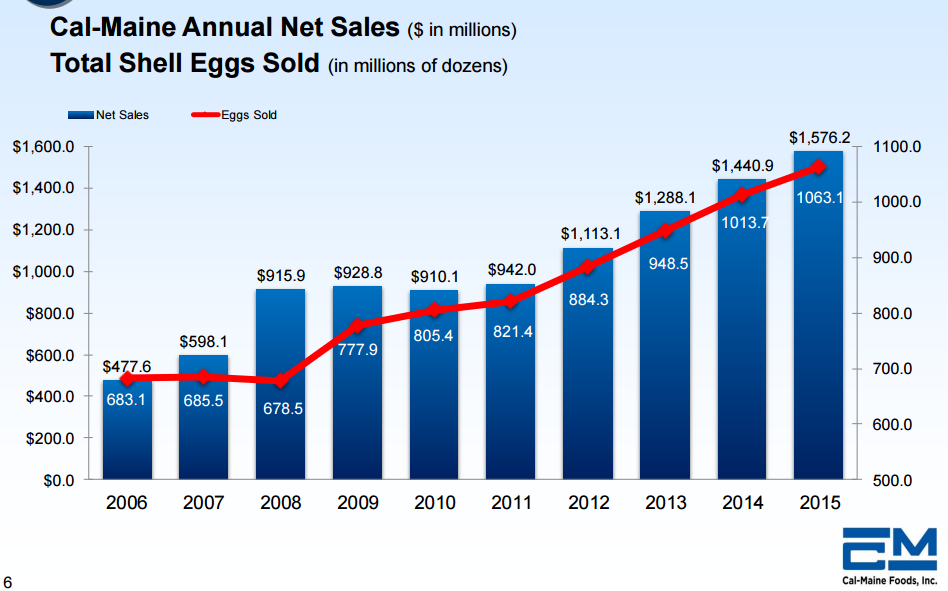
Source: CALM investor presentation
I must admit I like the defensive taste of this small company (market cap of 2 billion) combined with a spicier taste for growth by acquisitions. While CALM is the biggest US egg producer, there are over 60 smaller egg producers under them. This is a highly fragmented market opening the door to CALM to use their acquisition expertise in order to grow even faster in the upcoming years.
The company has an unorthodox way to pay their dividend by distributing a variable dividend which is equivalent to ? of net income quarterly. This makes for a strange dividend growth curve but it is still effective as the company is not stuck with high dividend payments and keeps their payout ratio at 33%:
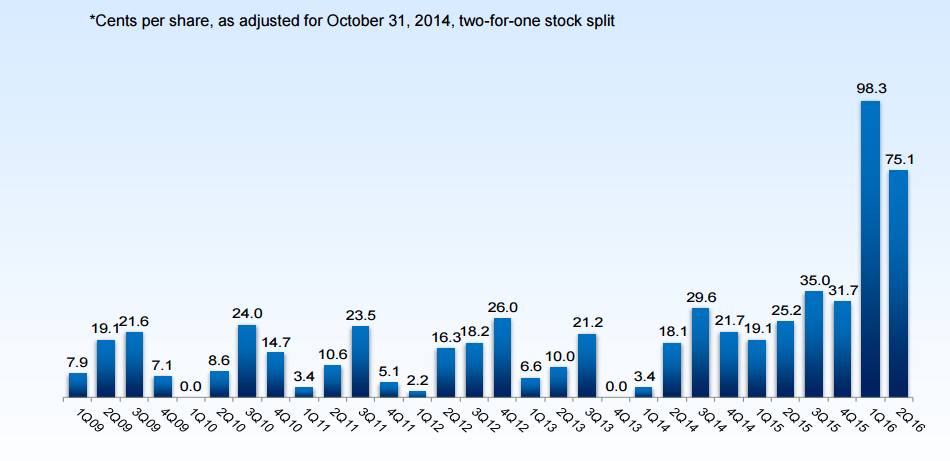
Source: CALM Investor Presentation
The stock price went up by 268% over the past 5 years but the company is still trading at a 7 PE ratio. I think there is something to take a look right now…
High Liner Food (HLF.TO)(HLNFF)
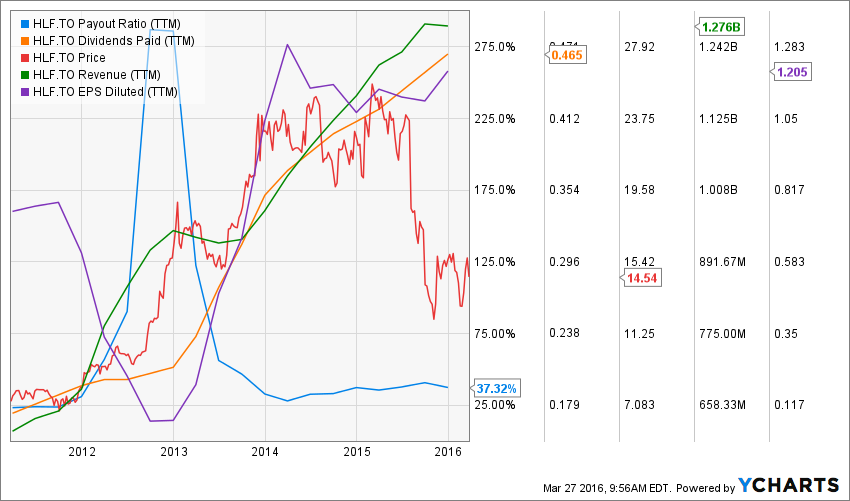
source: Ycharts
HLF is the leading North American processor and marketer of value-added frozen seafood. The company is in operation for the past 115 years and offer over 30 species among its line of products. The company sales its product through all major supermarket chain across Canada and USA.
For first, let’s say the healthy trend is playing in favor of HLF. The population realize eating more fish is better for their health than their good old steak. Plus, 45+ counts for half of the fish & seafood consumption and we know we are facing an aging population. This means more clients for HLF! The company makes 71% of its revenue in USA & Mexico, a growing market. The company is showing strong dividend metrics and great room for additional dividend increase in the future.
Oddly enough, the company reported decrease in sales and earnings over 2015. While logic tells us the market is increasing, HLF failed to prove it this year. Nothing to help; the USD increased drastically their cost of operation once converted in CAD. The company stock plummeted by 30%. While the overall numbers over 5 years are great, we will have to watch carefully their financial results in 2016.
How the Rock Solid Ranking is built
I personally use this list to manage my own portfolio along with portfolios I manage at Dividend Stocks Rock. This is not an ordinary ranking where we arbitrarily apply a score to dividend stocks. We actually build a dividend growth model where multiple factors are accounted for in the score calculation. We started by listing the most important metrics we follow before buying a stock. Here’s the list:
1 year Revenue Growth
5 year Revenue Growth
1 year Earnings per Share (Diluted) Growth
5 year Earnings per Share (Diluted) Growth
1 year Dividend Growth
5 year Dividend Growth
Dividend Payout Ratio
P/E ratio PEG
Dividend Yield
Debt to Equity ratio
Price to Book Value
Explanation of metrics used
In order for you to understand why I have decided to use the above mentioned metrics instead of others, I’m providing you with this complete explanation of how I came up with this ranking.
If a company can’t keep up its high ranking, it means its losing pace with one or more important metrics in our model. The more it loses ranking, the closer it is to joining the sell list. On the other hand, a company that improves its scores quarter after quarter definitely earns the buy mention as it shows it’s headed in the right direction. The Rock Solid Ranking goal is to provide you with an instant valuation of a stock according to our dividend growth investing model.
I’m not going to disclose our calculation methods here but I’ll tell you which metrics we follow. This can help you build your own investing model. Total score of a company could technically reach 100% if it was perfect on all attributes. The score can also be negative as we give penalties for negative growth numbers.
#1 SALES
In my opinion, if you don’t sell, you can’t make money. If you can’t make money, you can’t pay dividends. If you can’t increase your sales, you can’t increase your profits and you can’t increase your dividend. This is why revenue growth is so important. The best way to measure if a company is making more money is by looking at its revenue growth.
A company can run through a tough year or show erratic revenue movements. This is why we take a look at both 1 yr and 5 yr revenue growth. The first metrics to be used in our model are:
1 year Revenue Growth
5 year Revenue Growth
More weight is given to the 5 yr and penalties (negative score) are attributed to companies that show negative revenue growth. You can’t hope to increase your dividend consistently if your revenues decrease.
#2 PROFITS
Showing strong revenues is important, but it doesn’t guarantee you will get strong dividend payouts. Profits drive amounts to be paid through dividends. If you look at a company like Amazon (AMZN); revenues are huge but profit is thin. Therefore, they can’t hope to pay a dividend at this point in time (especially when your P/E is 574!).
In order to make sure we don’t give a high score to a company that recently restructured its costs or sold an important asset to boost its profits, we also consider 1yr and 5yr Earnings Per Share (EPS) growth.
1 year Earnings per Share (Diluted) Growth
5 year Earnings per Share (Diluted) Growth
Earnings and revenue growth combined together weigh a lot in our model. Both metrics combined together is the key for a sustainable business model. This is why so much weight (40%) is attributed to these 4 metrics.
#3 DIVIDEND METRICS
Once we have found companies with sales and profits, it’s time to take a look at what we desire most: dividend growth potential! In order to find out if a stock is not only a good stock but a good dividend stock, we use 3+1 different metrics. The “+1” is because we look at both 1yr and 5yr dividend growth percentages:
1 year Dividend Growth
5 year Dividend Growth
Dividend Payout Ratio
Dividend Yield
The 1 year dividend growth shows the company’s willingness (or capacity) to increase its dividend over a short period of time. The 5 year dividend growth confirms this willingness/capacity to keep increasing payments to shareholders.
Then, the dividend payout ratio is also very important to us. We penalize companies paying over 120% of their earnings. We didn’t select 100% as we must always take into consideration that the payout is in $ and profit is an accounting term (including amortization for example). This is why it’s important to give some room for high dividend payout ratio companies. We also give a smaller weight to companies with very low payout ratio (0-20%). This shows that the company would rather keep its money in their bank account instead of sharing the wealth with stockholders.
Finally, the dividend yield is also a debated topic. Some investors are looking at 5%+ dividend yield (I keep receiving tons of email telling me I look for low yield dividend stocks). Many investors (like me!) prefer sound businesses with dividend stocks around 3%. In the past four years, I’ve noticed that stocks paying over 4% often show shakier metrics than stocks with a lower yield. Dividend metrics combined together represent 40% of our ranking calculation.
#4 DEBT LEVEL
Another important consideration is the debt level of a company. The idea behind the choice of this is simple; debt payment requires cash flow, cash flow that could be used to pay dividends. You don’t want a company strangled by their debt and forced to make unfortunate decisions. This is why we use a debt ratio in our model:
Debt to Equity ratio
Here again, a high debt to equity ratio is penalized by negative points.
#5 STOCK VALUATION
Finally, the price you pay for a stock is also important. I’m the first one to pay a relatively high price for a great company. Still, if I can find a company that is relatively similar but traded at a cheaper price than another, I will definitely take a look at it.
We have used the following metrics in our system to give points to each stock:
P/E ratio PEG
Price to Book Value
Disclosure: None.
Disclaimer: Any information shared on The Dividend Guy does not constitute financial advice. The Dividend Guy is ...
more

