10th Year U.S. Bull Market Run Versus 'Summer Swoon'
Further to my post of March 10, we may be seeing the beginnings of a 10th-year bull run, inasmuch as volatility of the SPX, NDX, and RUT has been attempting to stabilize recently.
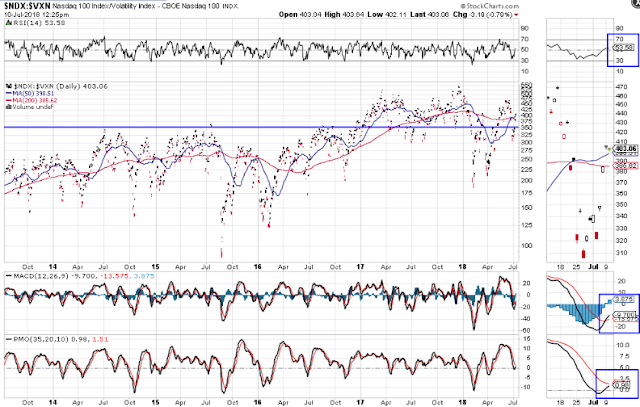
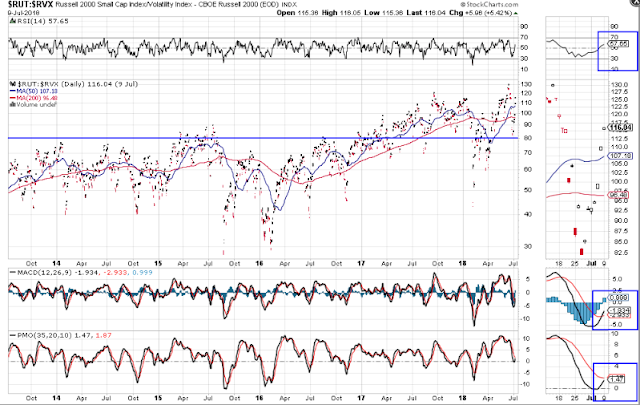
However, this attempt is not yet a slam dunk. As noted on the following daily ratio charts of the SPX:VIX, NDX:VXN, and RUT:RVX, I'm still waiting for:
SPX:VIX ratio: a bullish crossover of the 50 MA above the 200 MA to form a Golden Cross
NDX:VXN ratio: a bullish crossover of the PMO technical indicator
RUT:RVX ratio: a bullish crossover of the PMO technical indicator
All other technical indicators must continue to hold their present bullish formations, and price needs to hold above their respective major support levels, namely:
SPX:VIX: 200
NDX:VXN: 350
RUT:RVX: 80

From the next chart, which compares price action and percentages gained year-to-date of the four major indices, we see that the Dow 30 and S&P 500 Indices will need to pick up the pace in order to provide some kind of assurances to traders/investors that there is broad support for a 10th-year bull run.
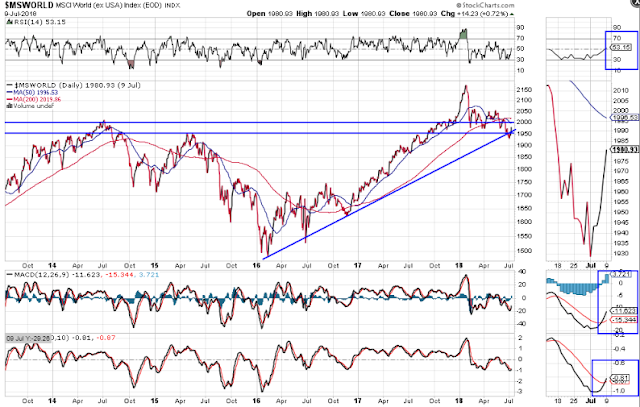
Otherwise, we just may see a 'summer swoon,' as I described in my post of June 30. In this regard, I'm continuing to monitor the World Market Index (last chart). If we see a break and hold above its next resistance level of 2000, a reversal of the bearish moving average Death Cross to form a bullish Golden Cross and maintenance of bullish formations on all three technical indicators, such a swoon may be averted.
Keep an eye on the above three ratio charts, as well as the World Market Index for cross-confirmation of either scenario.