
The Bounce From Oversold Survives An Early Test
AT40 = 22.0% of stocks are trading above their respective 40-day moving averages (DMAs) – ends an 11-day oversold period that followed a 4-day oversold period
AT200 = 31.6% of stocks are trading above their respective 200DMAs
VIX = 19.5
Short-term Trading Call: bullish
Commentary
If you are a long-term passive index investor, you can return to your regularly scheduled programming. Just make sure to check back in if the S&P 500 (SPY) manages to break down below the low of this latest selling cycle (around 2600). For those interested in short-term trades, the drama continues apace.
Friday was a day of spills and thrills as the headlines from another strong jobs report faded fast in the wake of the Trump administration broadcast conflicting messages about the prospects for an imminent trade deal with China.
I was not aware of the headlines until after the close of trading; I am thankful I was not paying attention to that source of confusion and distraction. I was focused on executing my trading strategy for a market that I assume is moving away from oversold conditions and facing down its next challenges at 200-day moving averages (DMAs).
AT40 (T2108), the percentage of stocks trading above their respective 40DMAs, closed at 22.0%, a slight gain over the previous day. AT200 (T2107), the percentage of stocks trading above their respective 200DMAs, closed at 31.6%, essentially flat with the previous day. The S&P 500 (SPY) gapped up but sold off all the way below the intraday lows of the previous two trading days before bouncing back. Although the index netted a 0.6% loss, I call the day overall a small victory.
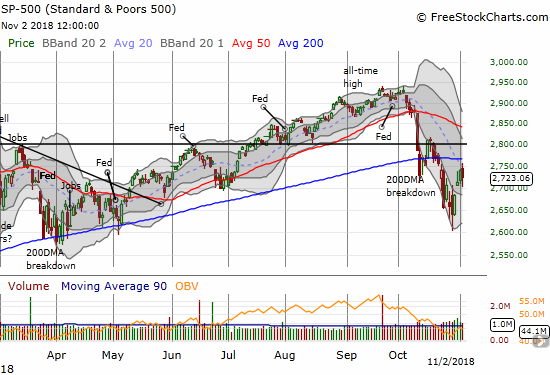
The S&P 500 (SPY) almost challenged its now declining 200DMA resistance. The 0.6% loss was not enough to drop the stock market back into oversold territory.
The NASDAQ and the Invesco QQQ Trust (QQQ) behaved like the S&P 500. Most importantly, QQQ directly challenged its 200DMA resistance and got rejected. This is the second day in a row with QQQ tussling with this critical trendline.
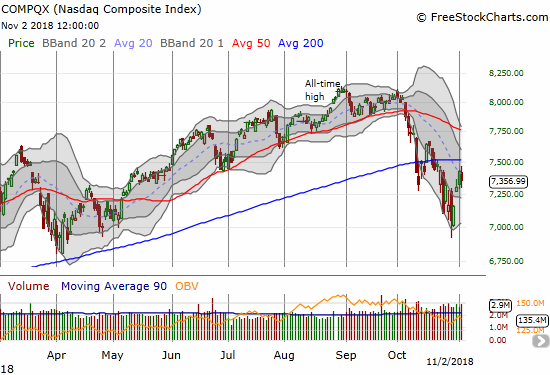
The NASDAQ lost 1.0% as its downtrending 20DMA held as resistance.
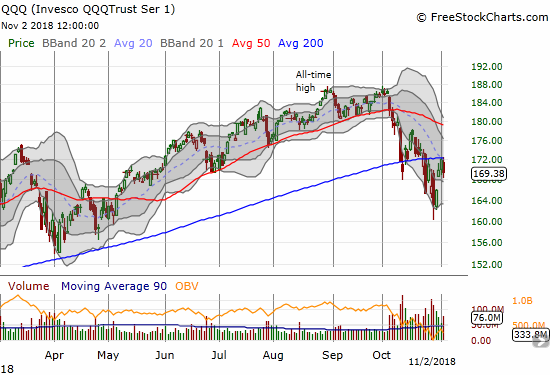
The Invesco QQQ Trust (QQQ) lost 1.6% and also lost its battle with 200DMA resistance.
The volatility index, the VIX, delivered another small victory. The VIX made a fractional gain after gapping down and then soaring past the previous day’s intraday high. It closed at 19.5 and remained below the 20 “elevated” level. As I wrote earlier, I expect volatility to implode after the election with no expectation for the outcomes. My put options on ProShares Ultra VIX Short-Term Futures (UVXY) teased me by going into the green soon after the open only to close the day back into red territory.
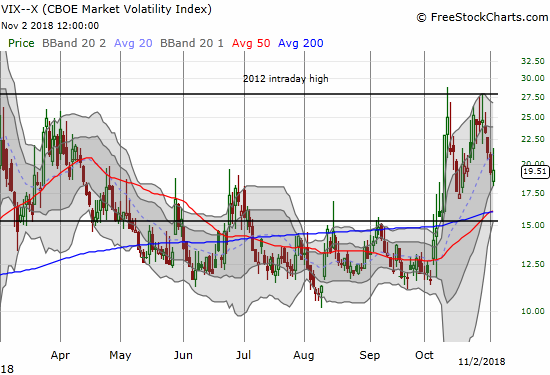
The volatility index, the VIX, gained 0.9% but stayed below the 20 level which is the threshold to “elevated” levels.
The intraday volatility on the day allowed me to flip call options on SPY. My core index play remains Shares Russell 2000 ETF (IWM) call options and now for a longer stretch shares of ProShares Ultra S&P500 (SSO). IWM out-performed the market with a 0.3% gain. Several hedges expired harmless last week. Looking back, I wish I was a little more aggressive in closing out some of them. Next week’s hedges are mainly the long side of calendar put spreads whose short sides expired harmless this week. I am not interested in adding fresh hedges and will remain aggressive on the long side (mainly for swing trades). I am particularly interested in accumulating shares and calls on companies that survived their earnings with gains with a preference for stocks trading above their 200DMAs. Swingtradebot is a great tool for scanning for such stocks. I will also do my best to post some ideas here.
CHART REVIEWS
Apple (AAPL)
If not for AAPL’s big 6.6% post-earnings loss, QQQ would have accomplished a bullish 200DMA breakout. Instead, the market is left on pins and needles wondering whether AAPL is the former “safety play” that could drag the market down. I was positioned bullishly going into earnings and took some profits beforehand. After earnings blew up my call spread, I returned to the AAPL weekly trade. I made a lowball offer for weekly calls. I was actually a bit surprised they got filled….even more surprised to see AAPL continuing to sell from there. AAPL just barely closed above its intraday low for the week. This is a 3-month low for AAPL.
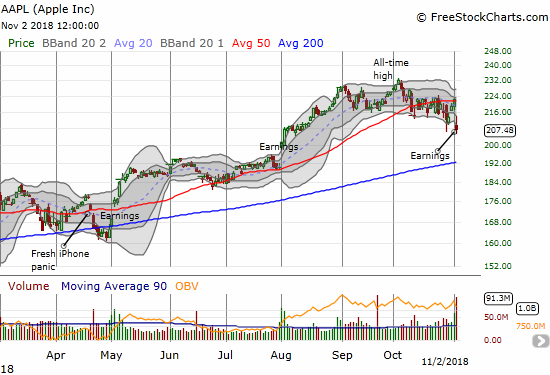
Apple (AAPL) barely escaped its 6.6% post-earnings loss with a defense of the intraday low that started the week. AAPL also made a rare close below its lower Bollinger Band (BB)
Amazon.com (AMZN)
AMZN gapped up right to its 200DMA. Once momentum began to fade I took profits on my calendar call spread. This trade confirmed for me the usefulness of the calendar spread for playing the 2-week post-earnings trade on AMZN. The trade was also another example of how it can be worth forgoing the upside of straight options with the flexibility of the calendar spread (meaning timing can be less precise).
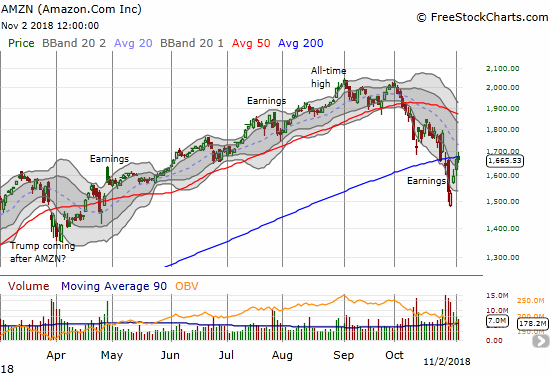
Amazon.com (AMZN) failed to hold a 200DMA breakout. Its impressive V-shaped rebound is now in jeopardy of confirming 200DMA resistance.
Ali Baba Group Holding (BABA)
BABA traded as high as $154 post-earnings, but the stock could not hold. BABA ended the day with a 2.4% loss. I did not take profits on my call spread as China’s Singles Day still lies ahead on November 11th.
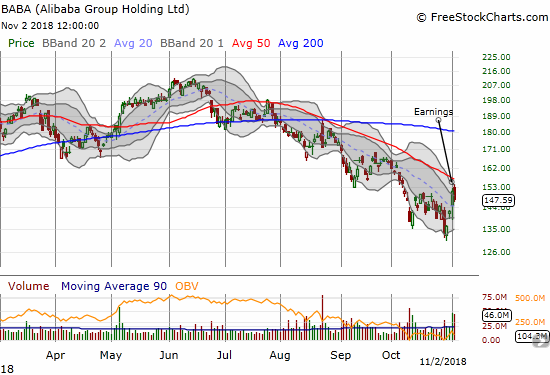
Ali Baba Group Holding (BABA) bounced all over the place post-earnings but ended up with a 2.4% loss. The stock closed in on its downtrending 50DMA resistance at one point.
Baidu (BIDU)
BIDU is my second favorite Chinese stock to pick up off recent lows. The market’s volatility allowed me once again to flip call options. I am looking to get right back in on any follow-through selling on Monday. The downtrending 50DMA sticks out as an obvious short-term upside target.
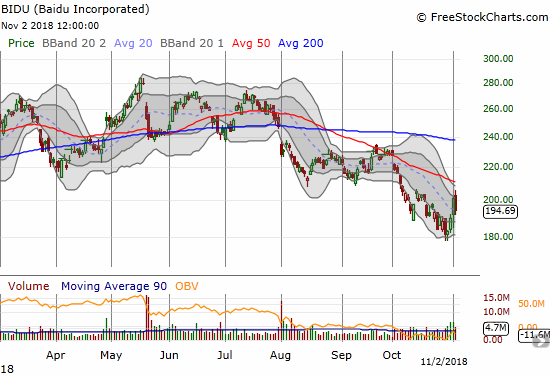
Baidu (BIDU) pulled back by 3.4% and at one point was even with the previous day’s open. The peak from the last (short) bounce held as resistance.
The Chinese yuan (USD/CNY)
The Chinese currency, the yuan, finally put on a display of strength last week. The two down days for USD/CNY were the largest such combination since the first of this year. This could finally signal an end to the persistent weakness in the Chinese currency, but it bears watching. If a new downtrend develops on USD/CNY, I will naturally get more aggressive with China-related stocks.
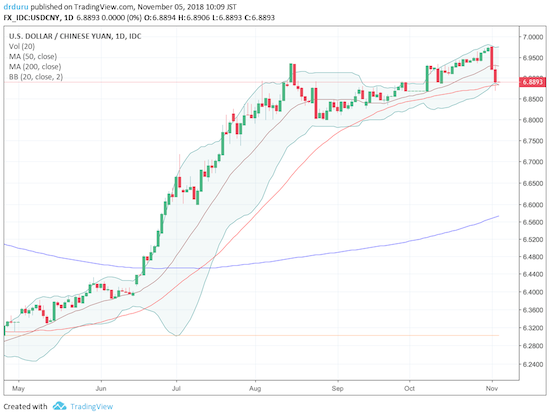
Did USD/CNY finally hit a top? The Chinese yuan may finally be ready for some kind of comeback.
Source: Trading View
The Australian dollar (AUD/JPY)
The Australian dollar (FXA) is another important indicator in the currency market. The currency soared ahead of the new strength in the Chinese yuan. The rally in the Australia dollar versus the Japanese yen (FXY) helped to shore up my confidence in buying during the oversold period. Critically, AUD/JPY faded from its downtrending 200DMA resistance on Friday. I moved to short AUD/JPY as an important forex hedge.
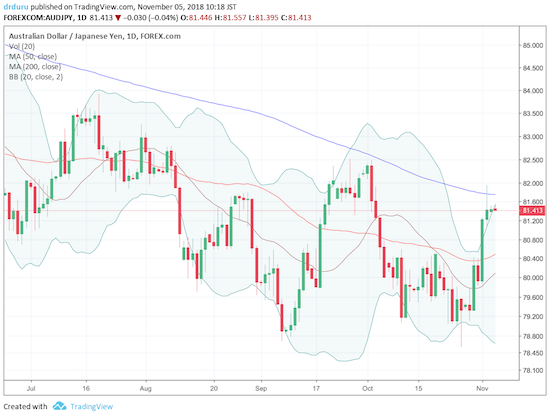
Is the rally in AUD/JPY coming to an end with the rejection from 200DMA resistance?
Source: Trading View
BHP Billiton (BHP) and Rio Tinto (RIO)
BHP and RIO are in a great position for the latest pairs trade. BHP settled for a close on its 200DMA. RIO faces stiff overhead resistance from the prior peak and its 200DMA. While both stocks joined the market sell-off in October, iron ore managed to rally all month long on a major breakout. The rally caught me doubly off-guard because the Australian dollar did not benefit from the big bounce in price (see AUD/JPY above). Time for me to get back on top of my iron ore news! This rally should be a very bullish indicator for the global economy.
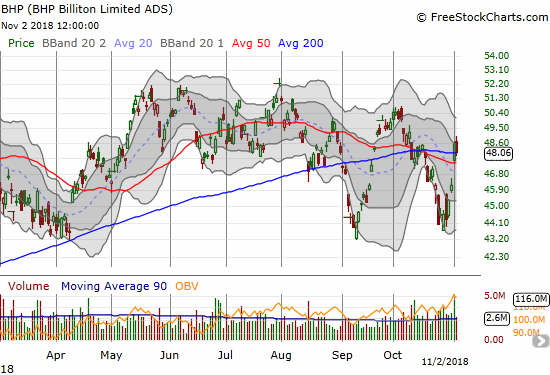
BHP Billiton (BHP) dropped back toward 200DMA support with a 0.9% loss.
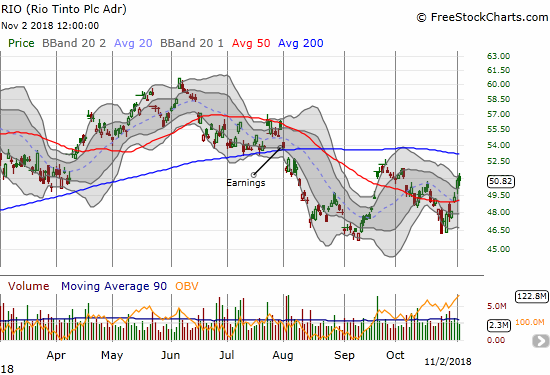
Rio Tinto (RIO) gained 0.1% and now looks like it might struggle with resistance at the previous peak set in late September/early August.
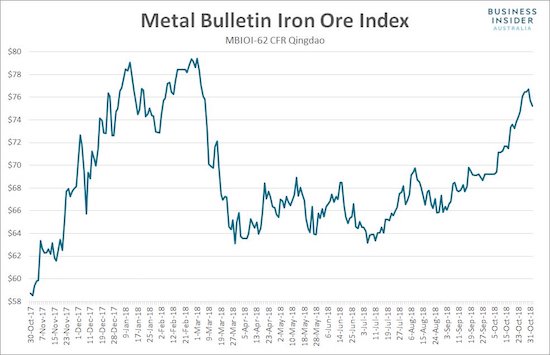
While global stock markets sold off in October, iron ore, surprisingly, soared.
Source: Business Insider
Caterpillar (CAT)
CAT had a strong week gaining about 9%. At one point, CAT even effectively closed its post-earnings gap down. I am expecting a fade from here. Follow-through buying will be very bullish with an obvious near-term upside target at the 50DMA.
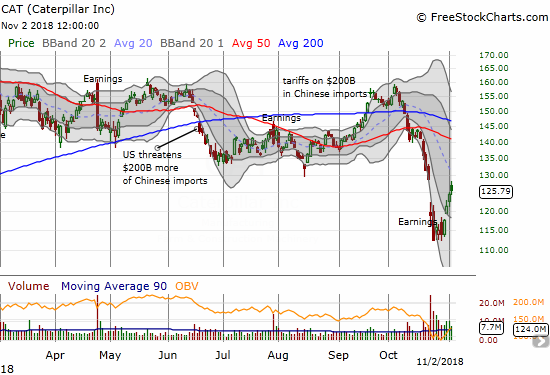
Caterpillar (CAT) still gained 0.9% despited pulling back from its intraday high. That high essentially finished reversing the post-earnings gap down.
Eventbrite (EB)
During the sell-off, I claimed that a lot of high-flying, high-priced IPOs would return to their IPO prices. EB got as low as $25, $2 above its IPO price of $23. That drop might be close enough. EB gained 18% for the week.
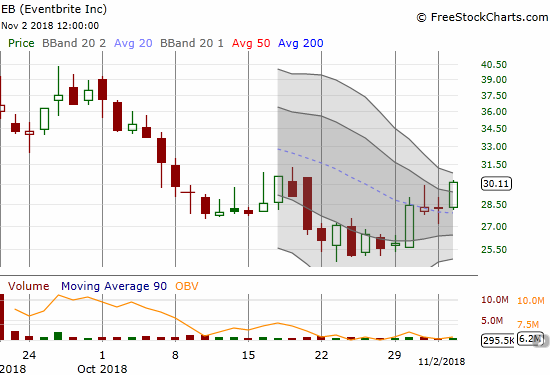
Eventbrite (EB) gained 6.6% to trade back at its last rebound high.
Starbucks (SBUX)
SBUX has been a strange stock. After a reset on strategy and a 3-year low this summer, the stock slowly but surely churned its way higher. On Friday, the stock surged 9.7% post-earnings near a fresh all-time high. SBUX has never traded higher than Friday’s intraday high. I expect SBUX to churn from here as it is well above its upper Bollinger Band (BB).
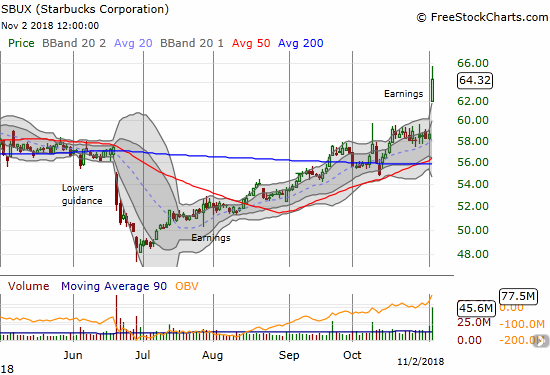
Starbucks (SBUX) soared a startling 9.7% post-earnings for a 17-month high and a close well above its upper Bollinger Band (BB).
Financial Select Sector SPDR ETF (XLF)
At its lows, XLF made a 13-month low. The bounce from those lows so far has stalled out at the previous line of support from the June/July low. So for now, the financial index still looks broken…and dangerous.
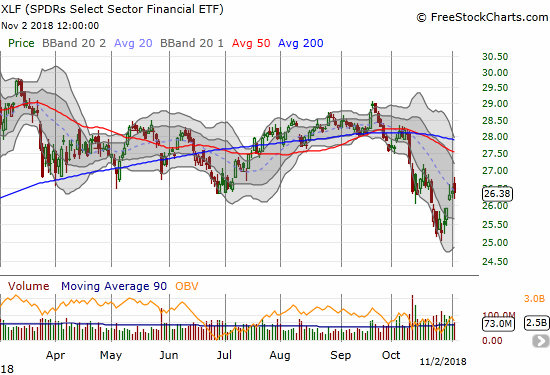
The Financial Select Sector SPDR ETF (XLF) ended the day flat after sharp fade from its intraday high. Will XLF start churning at this previous consolidation area?
Goldman Sachs (GS)
GS is like an exaggerated version of XLF; perhaps it is time for me to considered pairs trades between the two.
GS has rocketed from a near 2-year low on October 24th to a 9.8% gain since then and a fresh 50DMA breakout. The wild swings in GS are still a bit unnerving. At least this latest swing made a new high right after the new low. Maybe GS will now hold a trading range.
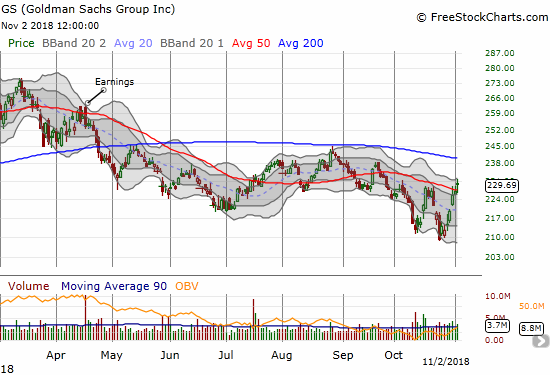
Goldman Sachs (GS) ripped higher off its 2-year low. Can THIS 50DMA breakout hold?
El Pollo Loco (LOCO)
The chicken trade is alive and well. The fortune for the latest swing through LOCO came from a nice, admittedly very surprising, 21.9% post-earnings surge. I of course took profits. I am guessing I will not get another opportunity to get a significant discount on LOCO for quite a while. I will still look to keep buying the dips.
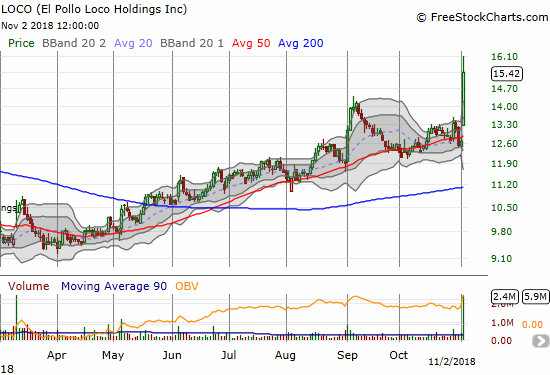
El Pollo Loco (LOCO) ripped higher post-earnings for a 21.9% gain and a 3+ year high!
Toll Brothers (TOL)
Home builders benefited greatly from the emergence from oversold conditions. They even led the way as the iShares US Home Construction ETF (ITB) refused to go lower during the last week of October. TOL will likely be the next major test with earnings coming in the first week of December. Unfortunately Friday’s trade delivered a major failure with TOL losing 2.3% on a confirmation of downtrending 50DMA resistance.
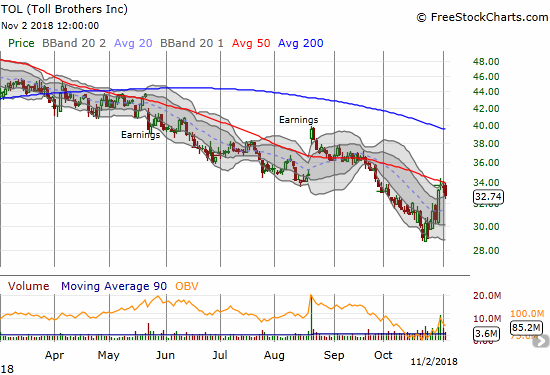
Toll Brothers (TOL) lost 2.3% as its declining 50DMA held as resistance.
Disclosure: I am long UVXY puts, long ITB calls and calendar call spread, long BHP calls, long RIO puts, long GS puts, long SBUX, long CAT puts, other positions mentioned above.
Follow Dr. ...
more

