
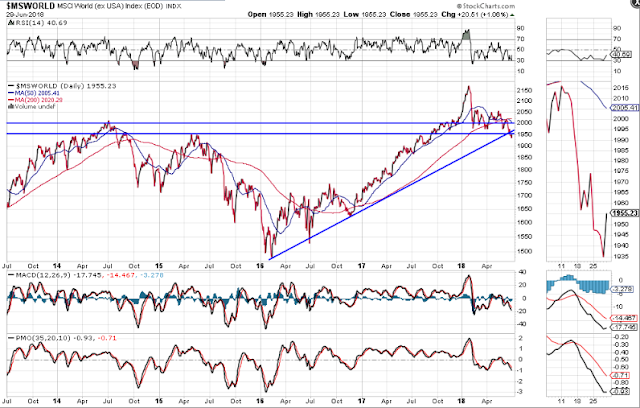
World Market Death Cross Forms: 'Summer Swoon' In Store For U.S. Major Indices?
As shown on the daily chart below, a moving average "Death Cross" has formed on the World Market Index. It closed out Q2 2018 just above horizontal price support and below trendline support, as well as below both moving averages.
All three technical indicators are in negative territory, hinting of further weakness ahead, particularly if price drops and holds below 1950 on accelerating RSI, MACD and PMO declines.
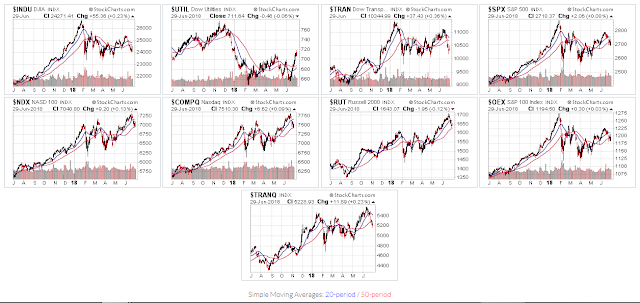
The following 1-year and 6-month charts of the U.S. Major Indices show where they closed out Q2, relative to their 50-day moving average.
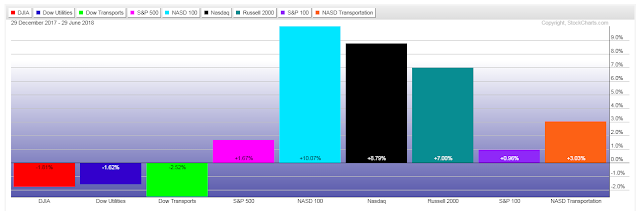
The following year-to-date graph of these Major Indices shows the percentage gained/lost for the first half of 2018.
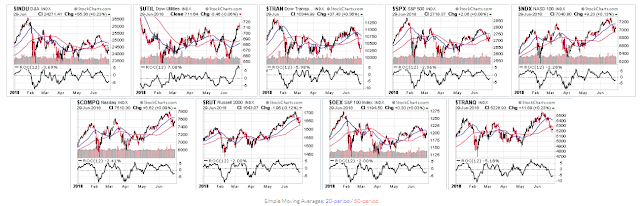
My general conclusion is, if we don't see some serious buying of the Dow 30, S&P 500, Nasdaq 100, Nasdaq Comp, Russell 2000 and the S&P 100 around their 50 MA soon, we may see the beginning of a 'summer swoon,' and, possibly, some aggressive selling until they reach their 200 MA. Keep an eye on the World Market Index for potential clues and on the ROC (rate of change) indicator on these Major Indices.


