
Why I'm Slashing My S&P 500 Exposure
The S&P 500 (SPX) is very rich and it should be faded as much as possible. The U.S. market is richly valued with a Total Stock Market Value to GDP of 132.9%. The Fed has started to tighten, and with delinquency rates are currently low, lending standards have started to loosen again. Insiders are very cautious and the Baltic Dry Index is not indicating a pending recovery.
The Buffett indicator
Warren Buffett famously proclaimed the total stock market value to GDP ratio as the best “one” indicator of future stock market returns. Currently Total Stock Market Value comes out to 132.9% of GDP which is very high in a historic context. Huge successful startups like Uber, Airbnb and Palantir are not even going public which is a headwind to total stock market value or it would have been even higher.
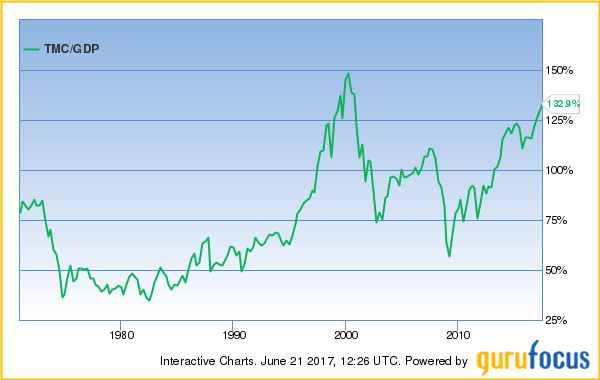
TMC/GDP
I picked this particular fundamental value ratio but it’s actually hard to find a ratio that doesn’t rate the market as expensive. The famous CAPE ratio would have worked just fine and the S&P is richly valued judging by mean PEs or price to cash-flow ratios as well, when put in a historical context.
Bulk shipping
The Baltic Dry Index is a great proxy for dry bulk shipping prices. Prices are a result of available transporting capacity and demand for said capacity. Capacity enters the market through ships delivered and exits the market when vessels are scrapped. Because it takes some time to build ships it is rather obvious when supply is entering the market. It’s not as obvious when ships get scrapped as it can happen fast once scrap rates jump. The higher steel prices, the more vessels get scrapped.
Demand is very unpredictable but it is a necessity for emerging markets to get going. Emerging economies require a multiple of commodities to power their infrastructure build outs compared to mature economies. This results in the Baltic Dry Index being an interesting indicator because when rates go up this indicates construction is going to pick up. After the materials arrive, builders get hired and sometimes the resulting infrastructure actually enables additional economic activity after it is finished.
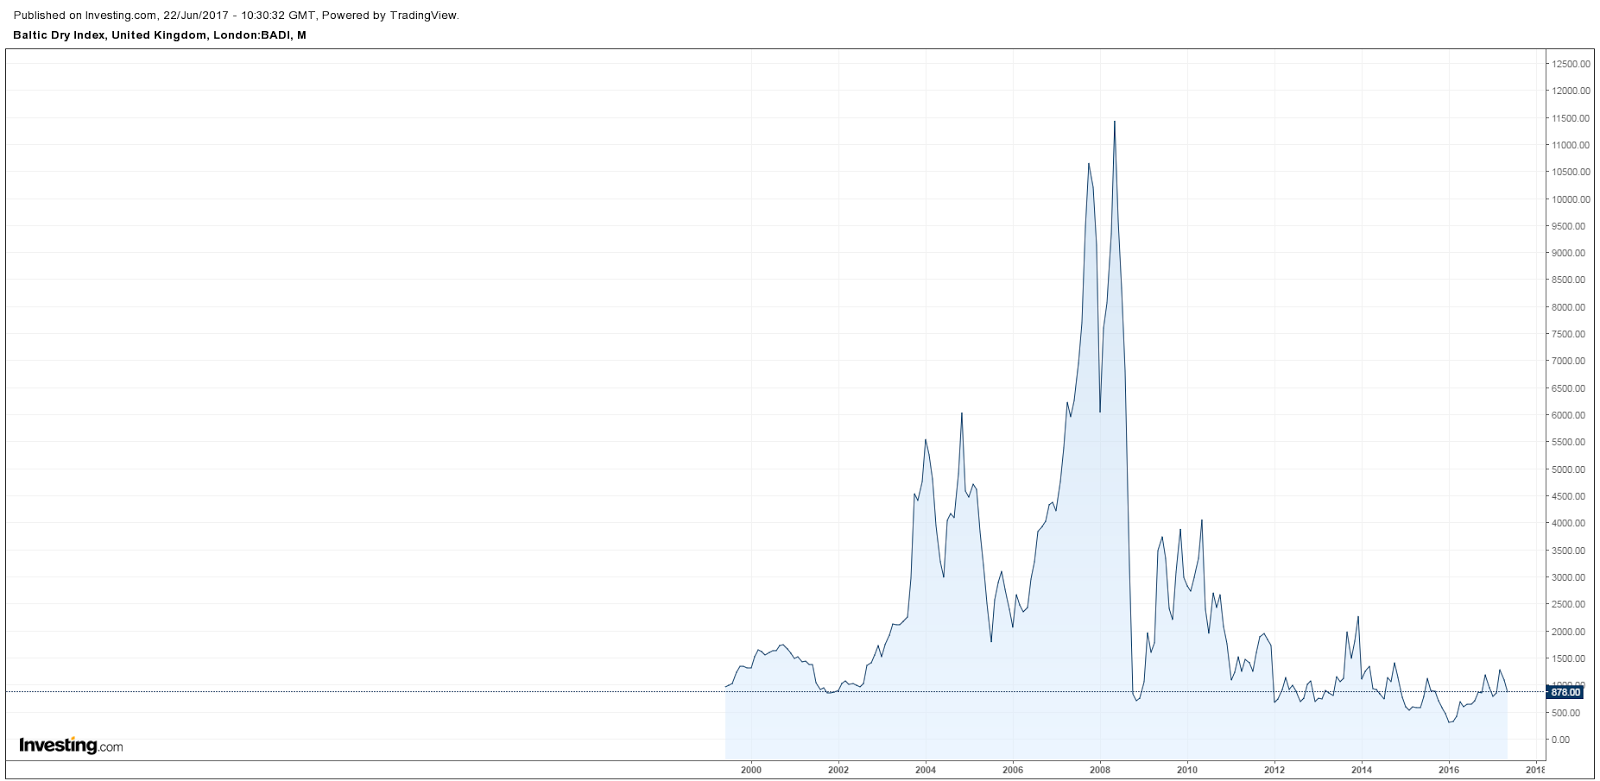
BDI 2000-2017 Source: Investing.com
Consumer delinquency rates
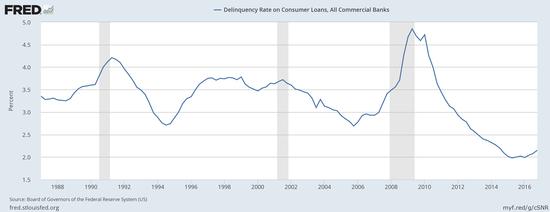
Consumer delinquency rates are currently just very, very low. It is almost reminiscent of 2007 and it looks like Gresham’s law may be at work once more. Gresham law states: “bad money drives out good money”. I pulled a large number of consumer credit offers through Moneybanker and low and behold: SoFi is offering the best rates in a number of categories. SoFi happens to be a private venture backed lender in the hot fintech space taking a spread that’s a fraction of what more traditional financiers like Discover Financial Services (DFS) take.
SoFi isn’t just winning in one category but besting others offers in poor credit, good credit, small loans and large loans. I’m quoting SoFi here (emphasis mine):
We look behind just credit scores and debt-to-income ratios to consider factors like estimated cashflow, career and education. So while other leaders charge higher rates to account for the possibility that borrowers won't pay back their loans, our unique underwriting process helps ensure our members have a high likelihood of making their payments.
Other leaders charge higher rates but we don’t because of our unique underwriting process…
I’m predicting these will turn out to be some famous last words. Credit scores and debt-to-income ratios aren't just old fashioned. They are time-tested predictive attributes. I'm betting Fintechs aren't going to do better issuing credit based on number of friends on Facebook (FB). I really do have faith in big data and credit distributed through the internet but before we get to a healthy market we’ll see some real trainwrecks among venture backed finance startups.
Insider Buying
Everyone knows how important it is to watch insider buying at the company level. But it is also indicative of future returns when applied to the aggregate. Insiders, as a whole, are usually net sellers. They often take part of their salary through shares or options to incentivize them to make the company a success. Gurufocus keeps a running count of the aggregate buy/sell ratio. At this time we are at 0.3 which is significantly below the historical average of 0.4. Insiders are bearish and they have been so for a couple of quarters.
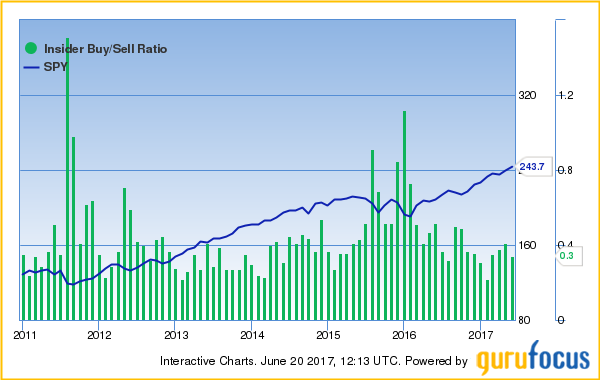
Insider buy/sell ratio vs SPY
Summary
Fundamental value ratios show the S&P 500 sports elevated ratios. There seems to be no impending boom in the world economy when judged by the Dry Bulk Index. Delinquency rates are very low which may have spurred undisciplined lending. Insiders are net sellers and more so than usual. I believe these are several important and uncorrelated signals that it is prudent to decrease exposure to the S&P 500.


When you think of a healthy Total Stock Market Value to GDP ratio, does any number come to mind? What would you say is a good TMC/GDP ratio?
Really good question Fabrizio. Maybe it's helpful to realize historically the range for the U.S. has been between 35% and 149%. Obviously 132.9% is much closer to the high end of the range.
Thanks for sharing