
Why A 15 P/E Ratio Represents Fair Value For Most (Not All) Companies
Introduction
One of my favorite Warren Buffett quotes is “investing is most intelligent when it is most businesslike”. The reason this quote resonates so much with me is because I believe it represents the essence of value investing. To me, value investing is about positioning yourself as a shareholder/owner/partner in a wonderful business that you admire and want to partner with long-term. In the past, I referred to this as a business perspective investing. This is in stark contrast to trading stocks or playing the market.
Consequently, business perspective value investors are most concerned with the results the business is generating on their behalf. By this I mean the revenues (sales), profits (earnings), cash flows, and if any dividend production and growth, etc. In other words, the fundamentals and fundamental value of the business. Therefore, the business perspective value investor’s most important question is – how’s business? This is in stark contrast to the market player whose most important question is – how is the stock price behaving? In short, the business perspective value investor expects to be rewarded by their businesses operating performance instead of the less reliable and often fickle stock market behavior.
Nevertheless, even though most of us are small players investing in mammoth publicly traded companies, the principles of business ownership still apply. Personally, I believe the realization of the insignificant level of ownership that most individual investors have is what causes them to forget about the principles of business perspective investing and focus more on market action. Many investors find it a huge leap to think of themselves as owners or partners of Apple, Google, Johnson & Johnson, Home Depot, Walmart, 3M – or any other large publicly traded company. Yet, in truth and fact, if you buy stock in any of those companies you, as a shareholder, are also a partner and an owner. So, my advice is you should think like one.
The P/E Ratio Is Simply a Thermostat
Business perspective value investors utilize and think about valuation references such as the P/E ratio differently than stock market investors. Consequently, I want to be crystal clear that my following discussion of the P/E ratio is referencing utilizing the metric to ascertain a company’s intrinsic value/business value. This is in stark contrast to those who are thinking of P/E ratios as they relate to how the market may be treating a given company.
Once again, as I stated in part 1, these are the distinctions that Ben Graham was making with his famous short run voting machine, long run weighing machine metaphor. Market action P/E ratios are all about how people are voting based on a perception of value for a given common stock. Intrinsic value P/E ratios are focused on the weight or substance of the business relative to its fundamentals as described above. Therefore, all my following discussions are based on the weighing machine concept of the P/E ratio.
Importantly, this is precisely why valuation is not in the eyes of the beholder. That notion only applies to the voting or market action aspect of P/E ratios. To the business perspective value investor, the P/E ratio (as well as numerous other valuation metrics) are utilized as methods of measuring the intrinsic value of a company based on its production of earnings and cash flows, etc. Stated succinctly, the P/E ratio utilized by the business perspective value investor is simply a mathematical measurement (a thermostat) of what I will call owner’s yield. In other words, the P/E ratio is simply indicating the earnings yield that the company’s most recent profitability is providing them.
Earnings Yield the Inverse of The P/E Ratio
Earnings yield is simply the inverse of the P/E ratio. When you divide the company’s earnings by its price the result is the return that all the company’s earnings would provide you if they were all to be paid to you. These numbers are what a business perspective value investor sees in their mind’s eye when they note a company’s P/E ratio. The following table calculates the earnings yield of various P/E ratios:
P/E ratio 5 equals earnings yield of 20%
P/E ratio of 10 equals earnings yield of 10%
*P/E ratio of 15 equals earnings yield of 6.67%
P/E ratio of 20 equals earnings yield of 5.00%
P/E ratio of 25 equals earnings yield of 4.00 %
P/E ratio of 30 equals earnings yield of 3.33%
P/E ratio of 35 equals earnings yield of 2.86%
P/E ratio of 40 equals earnings yield of 2.5%
*the standard for most companies
Consequently, when a business perspective value investor sees a P/E ratio for a certain company, they never attempt to argue about or try to speculate about what it ought to be. Instead, they simply see it for what it is. Therefore, if that P/E ratio represents too low an earnings yield number, they are simply not interested in investing in that company. Also, they are unwilling to commit the necessary time and effort necessary for thoroughly researching the company as well. Moreover, they are focused on what the business can produce over speculating on what an emotionally driven market may or may not produce.
At the risk of being redundant, I want to be sure the reader understands what is being posited here. The business perspective value investor, like yours truly, is thinking about investing in a publicly traded company as if they were buying a private business in its entirety. Consequently, they are attempting to determine whether the business (not the market) provides them an adequate return on their invested capital. The P/E ratio then is a simple barometer or measuring device that allows them to quickly and easily determine if the company’s earnings power is compensating them for the risk they are taking.
Earnings Yield and Future Expectations
To better understand the important benefit of earnings yield, I developed a “10 Year Earnings Yield Estimates” calculator/table to provide economic perspective. Importantly, this calculator is very theoretical and is based on estimating earnings growth over a very aggressive 10-year forward timeframe. Obviously, estimating the future 10 years out is unlikely to be perfectly accurate. However, that is not the point of the exercise or the calculator. Instead, the calculator was designed to compare an equal investment in a company at any given valuation versus investing in a 10-year T-bond. Analysts do provide long-term earnings growth forecasts for stocks that typically equate to 3 to 5 year timeframes. These long-term forecasts are utilized to generate the future earnings yield estimates. Although these are aggressive assumptions, due to the uncertainty of the timeframe, they are often reasonable given the company’s historical achievements.
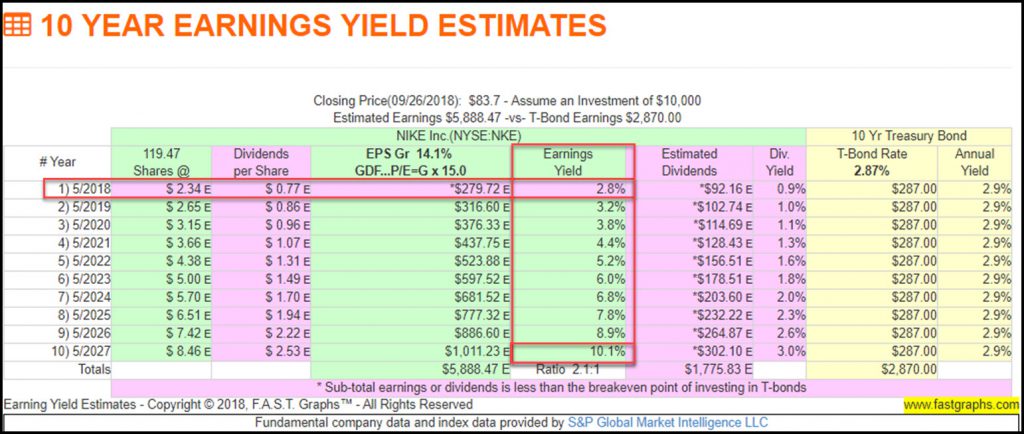
To illustrate the importance of earnings yield I selected two companies with similar historical actual and future estimated earnings growth achievements. The first is Nike (NKE), a company that I admire greatly but that I consider significantly overvalued at a current blended P/E ratio of 33.7. Nike has a May fiscal year-end and based on estimated earnings of $2.34 for fiscal 2018 (note: Nike exceeded estimates by reporting $2.40 actual), their estimated earnings yield for 2018 was 2.8% and their actual came in at 2.97%.
Nevertheless, this is an earnings yield that is approximately half of what a prudent business perspective value investor would require – which clearly indicates excessive valuation. Furthermore, note that based on an aggressive forecast earnings growth rate (EPG Gr) of 14.1%, Nike’s future earnings yield would only be 10% in the fiscal year 2027, if, in fact, it were to achieve that lofty rate of growth. This is not adequate compensation for the risk of investing in Nike today – in my humble opinion.
(Click on image to enlarge)
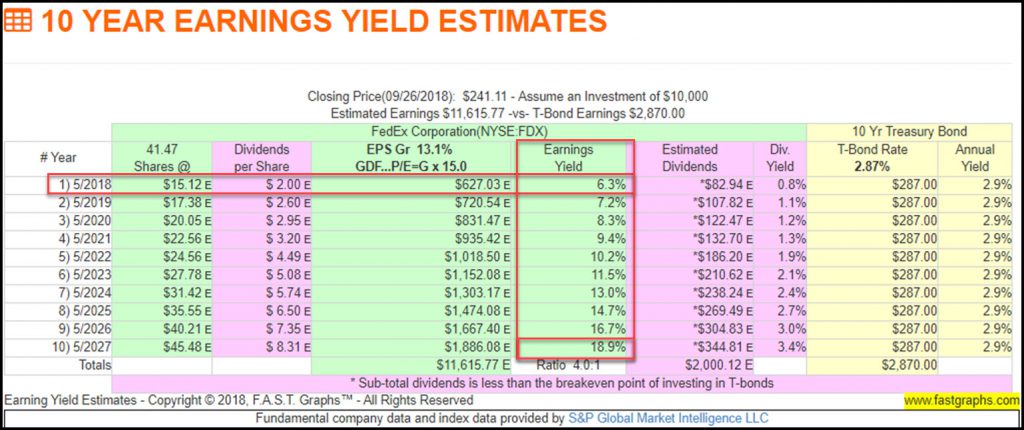
In contrast, let’s look at FedEx Corporation (FDX) and evaluate its future potential earnings yield in comparison. Both companies possess similar characteristics of historical growth and future growth. Moreover, they have similar fundamental attributes relating to their debt levels.FedEx is lower rated than Nike but much more attractively valued at a blended P/E ratio of 15.1. Furthermore, FedEx also has a May fiscal year-end which facilitates the comparison even more.
2018 consensus estimates for FedEx were $15.12.However, like Nike, they came in higher at $15.31.Based on the estimate as shown in the table, FedEx’s earnings yield would have been 6.3%. However, it came in at 6.62% based on current price and current P/E ratio. But most importantly, note that by the fiscal year 2027 the earnings yield for FedEx is estimated to grow to 18.9% – which is significantly higher than the 10.1% forecast for Nike.
(Click on image to enlarge)
Justification for the 6.67% Earnings Yield
Furthermore, this begs the question what level of earnings power (earnings yield) should a prudent investor be willing to accept or expect on their invested capital? In this regard, it is useful to recognize what rate of return stocks have historically delivered. For most of my career, which started in 1970, that number has been a 6% to 8% compound annual growth rate (CAGR). More recently, thanks to our current long-running bull market, that number calculates closer to a 9% to 10% range. Nevertheless, I continue to consider the 6% to 8% expectation reasonable and/or conservative. For those who would like to see more granularity on historical stock market returns, I offer the following link to a stock market returns calculator courtesy of moneychimp:
Clearly, and it is no coincidence, this return expectation closely coincides with the 6.67% earnings yield that a 15 P/E ratio calculates to. However, this would also suggest that P/E ratios lower than 15 would calculate at a higher earnings yield, and therefore, be even more attractive – and vice versa. With this in mind, my personal approach has been to look for companies that are currently available at P/E ratios of 15 or lower, and the lower the better. This doesn’t mean I will automatically invest in them, it simply suggests that I consider them worthy of conducting a more comprehensive research effort.
However, it should also be understood that these are guidelines and not absolutes. Moreover, later I will discuss why and under what conditions I would be willing to invest in a stock at a P/E ratio higher than 15. This is not a one-size-fits-all situation; however, it is a normal or average size that applies to most companies based on the logic presented above.
Nevertheless, with all of this under consideration, the 15 P/E ratio has been a stock market standard historically for many years. However, you can also think of a fair valuation range of P/E ratios for the stock market of perhaps 13 to 17. Once again, the lower the better. Additionally, FAST Graphs the fundamentals analyzer stock research tool applies fair valuation P/E ratios to companies driven by their earnings growth rate achievements. After studying literally thousands of companies, it has become quite clear that a 15 P/E ratio correlates very closely with the long-term movement of stock prices for most, but not all companies.
FedEx Corporation and the 15 P/E Ratio
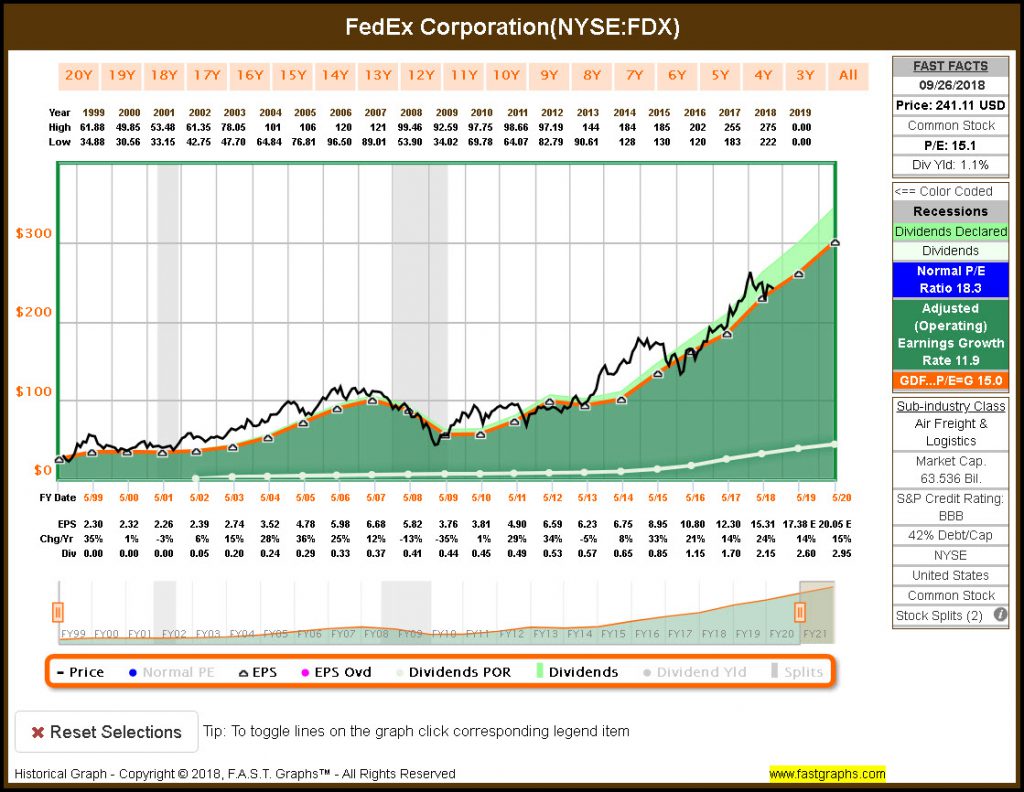
For example, I offer the following graph on FedEx Corporation whose future earnings yield estimates I cited above. The orange line on the graph represents a P/E ratio of 15 going back to the fiscal year 1999. Importantly, this is not theoretical, this is real world actual historical realities and results.
Note how the black monthly closing stock price line tracks the orange P/E ratio line of 15. Of course, it is not a perfect fit; however, every time the price deviates from the 15 P/E ratio notice how it inevitably moves back into alignment. This also illustrates the difference between market value and intrinsic value.
(Click on image to enlarge)
Intrinsic Value P/E Ratios Based on Earnings Growth
Everything I’ve written about so far relates to the current P/E ratio as a quick fair valuation indicator. However, there are also adjustments that can be applied when evaluating historical P/E ratios and adjustments that can be applied when evaluating future P/E ratios. Therefore, it might be helpful to share various definitions of the P/E ratio that I have presented in previous articles as follows:
The P/E Ratio – Definitions:
The P/E Ratio can be defined in several ways, with each definition adding insight to its significance. The simplest definition is simply the price of the common stock divided by its earnings per share. This is a basic mathematical definition expressed as follows: PRICE/Earnings = P/E Ratio.
A second commonly used definition is: The P/E Ratio is the price you pay to buy $1.00 worth of a company’s earnings or profits. For example, if a company’s stock has a P/E Ratio of 10, then you must pay $10 for every dollar’s worth of that company’s earnings or profits you buy. If its P/E Ratio is 20, then you pay $20 for every dollar’s worth of that company’s earnings or profits, and so on.
It is important to note, however, that a higher P/E Ratio does not necessarily mean that the company has a higher valuation or that it is more expensive than a company with a lower P/E Ratio. This fact is not understood by many investors and is the key reason that the P/E Ratio has little value by itself or if used in a vacuum. It is theoretically possible, depending on each company’s future prospects, that a company with a P/E Ratio of 10, for example, can be significantly more expensive than a company with a P/E Ratio of 40. I will elaborate on this important point later.
A third definition would be: How many years in advance you are paying for this year’s earnings. For example, if a company has a P/E Ratio of 20, then you are paying 20 times this year’s earnings. If the P/E Ratio is 10, you are paying 10 times this year’s earnings, and so on. This definition by virtue of adding the element of time illustrates a simple premise of what a prudent investor thinks an operating business is worth.
What is a Fair Value P/E Ratio?
To illustrate the relevance of the P/E ratio of 15 as fair value for most companies, I offer the following analogy based on the earnings of a private business. If you had a private business that was netting you $100,000 net, net, net after all expenses and taxes, it is unlikely that you would sell it to me for $100,000, or a P/E Ratio of 1.
A business that generates an annual revenue stream for its owner has a value greater than one year’s profits. This is true even if the company is not growing or not growing very fast. For example, let’s assume that the above private company does not grow, but that it does pay a consistent $100,000 per year of net income (hint: like a bond). If the owner sold it for one times earnings ($100,000) he or she would essentially have no money coming in after the end of the first year.
So this raises the question, what value should an owner place on a business they are desirous of selling? The optimum value would be to sell the business for a price where the net proceeds could be invested to generate a comparable income stream.
Note: since this is being offered as a theoretical mathematical exercise, I will assume no taxes or other costs associated with a sale. Therefore, for illustration purposes, let’s assume the owner could purchase a treasury bond paying a reasonable 6.67% return with the proceeds from the sale of the business. Therefore, the owner would need approximately $1,500,000 net after taxes earning 6.67% ($1,500,000 x 6.67% equals $100,050) in order to replace the $100,000 per year they were receiving from their business.In other words, this valuation represents a P/E ratio of 15.
From the purchaser’s perspective, if they paid $1,500,000 for the example business (the P/E ratio of 15), he or she in turn would be receiving a current earnings yield of 6.67%. Earnings yield (E/P) is the inverse of the P/E ratio. Since the average rate of return from common stocks has ranged between 6% – 10 % historically, a 6.67% expected current return might be considered reasonable by both the seller and buyer. If this were true, then this transaction theoretically benefits both buyer and seller and could be consummated.
This exercise establishes the P/E ratio of 15 as a baseline or rational valuation level from both a buyer’s and a seller’s perspective. This does not suggest that it is a perfect calculation of fair value, intrinsic value or true worth. Instead, a P/E ratio of 15 represents a sound valuation level that a business generating an income stream is worth, even if the business isn’t growing. However, this valuation level is only relevant if the business is generating a positive level of earnings. Therefore, I suggest that the reader might consider a P/E ratio of 15 as a benchmark for a sound valuation reference for average growing companies.
Moreover, a P/E ratio of 15 as a sound valuation reference is useful for most companies when their earnings growth is 15% or less. There are many investors that find this last statement either illogical or hard to accept. However, in my experience analyzing thousands of companies over many decades, the 15 P/E ratio as a valuation reference is fully supported in real-world circumstances. In my opinion, this speaks loudly to my earlier point that the P/E ratio cannot be utilized in a vacuum. Furthermore, a sound valuation does not in itself guarantee a high level of future returns.
To ascertain future return potential, I believe the P/E ratio needs to be evaluated in relation to the earnings growth potential of the company in question. A 15 P/E ratio represents soundness based on the earnings yield it represents, as illustrated in my private company example above. However, it is the P/E ratio in relation to the company’s earnings growth rate that will produce future capital appreciation and dividend income growth, if a company pays a dividend. Furthermore, this fair value P/E ratio applies to earnings growth up to 15% per annum. However, at 15% or greater growth is where the power of compounding kicks in. For companies growing this fast, the P/E ratio equal to the company’s earnings growth rate becomes more relevant than the simple 15 P/E ratio.
Sound valuation is primarily a measurement of risk associated with making a purchase of a common stock. However, from a total return point of view, it is a relative metric that is best evaluated in conjunction with earnings growth.
Nevertheless, the proof is in the pudding as they say. Therefore, I offer the following F.A.S.T. Graphs™ analyze out loud video where I review several prominent well-known stocks in relation to the 15 P/E ratio as a standard valuation reference. I will start out with the S&P 500, followed by several companies with various earnings growth rates. The company examples are offered in order of lowest earnings growth rates to highest. Moreover, I will show that companies that have higher earnings growth rates of say 20%, 30% or better will command P/E ratios that are higher than 15 but equal to the earnings growth rates. The video will show some examples.
(Video length 00:11:45)
Summary and Conclusions
I want to be clear that I do not believe that the P/E ratio is the go-to or only fundamental metric that investors can utilize to determine fair valuation. Instead, it is one of many that I will evaluate and utilize as part of a more comprehensive research and due diligence process. However, with that said, I do believe the P/E ratio is an extremely efficient metric that enables business perspective value investors to quickly determine whether they should even waste their time digging deeper into a stock they are considering. In short, I look to the P/E ratio to help me quickly decide whether a stock is research worthy or not.
Moreover, as stated in the article and supported in the video, valuation metrics serve as barometers or thermostats of relative valuation levels. For example, if I see a stock trading at an excessive P/E ratio, I immediately recognize that it’s highly unlikely that it is a great value or valuation play. Instead, I almost immediately understand that the market is likely appreciating the stock more than I do or would. This is true even if it’s a company that I consider of the utmost quality and one that I would be very desirous of investing in if I could get it at a prudent valuation.
Finally, as I illustrated in the video and described in the written portion of this article, a P/E ratio of 15 as a standard for fair value works for most companies. It’s not perfect, nor should you expect it to be. Instead, it is merely an excellent barometer that empowers you to efficiently make quick decisions on investments you should research further or skip. It is not the end-all, it is only the beginning of a more comprehensive research and due diligence effort.
Disclosure: Long FDX
Disclaimer: The opinions in this document are for informational and educational purposes only and should not be construed as a recommendation to buy or sell the stocks ...
more

