
Weekly Market Outlook - Lower Highs
Weekly Market Outlook - October 24, 2016
The bulls and the bears both took their shots at knocking the market off of the fence it's currently perched on. Neither team could get the job done. Stocks pretty much ended last week where they started it, but more than that they ended the week still trapped between a rock and a hard place.
We'll look at the range bound stagnation after painting the bigger picture with the broad brush strokes of last week's and this week's economic news.
Economic Data
A pretty good dose of economic data last week, especially for real estate. We got housing starts and building permits on Wednesday, and then existing home sales on Thursday (which will be rounded out by new home sales this week).
Before any of that was posted though, on Monday we heard September's capacity utilization and industrial productivity data from the Fed. It was....ok. Production was up 0.1%, quelling August's 0.5% lull. And, capacity utilization grew a bit, from 75.3% to 75.4%.This data has stabilized, and may even be on the mend. We'd like to see more improvement though to expect corporate earnings growth.
Capacity Utilization and Industrial Productivity Chart
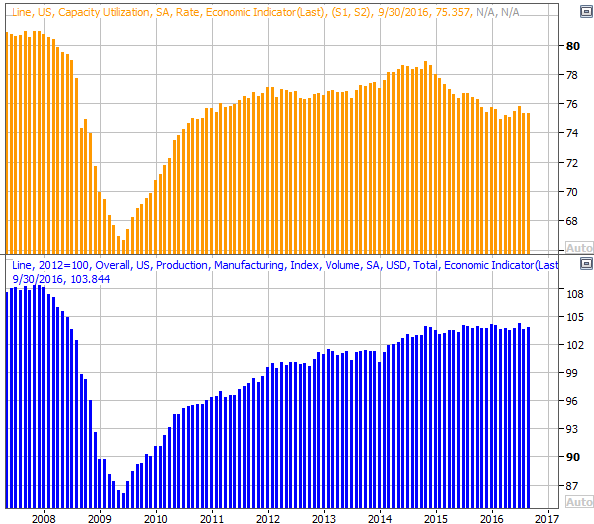
Source: Thomson Reuters
As for housing starts and permits, starts took a big plunge, falling to the lowest seasonally-adjusted pace since March of 2015. Hopefully that's just a fluke, though we can't gauge the economy on hope. Fortunately, permits edged a little higher, and they've remained firm for the past few months. Unfortunately, we need something a little stronger here.
Housing Starts and Building Permits Chart
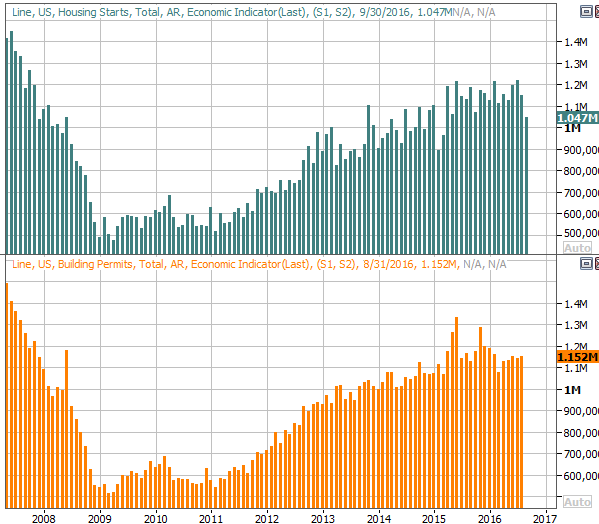
Source: Thomson Reuters
Everything else is on the following grid:
Economic Calendar
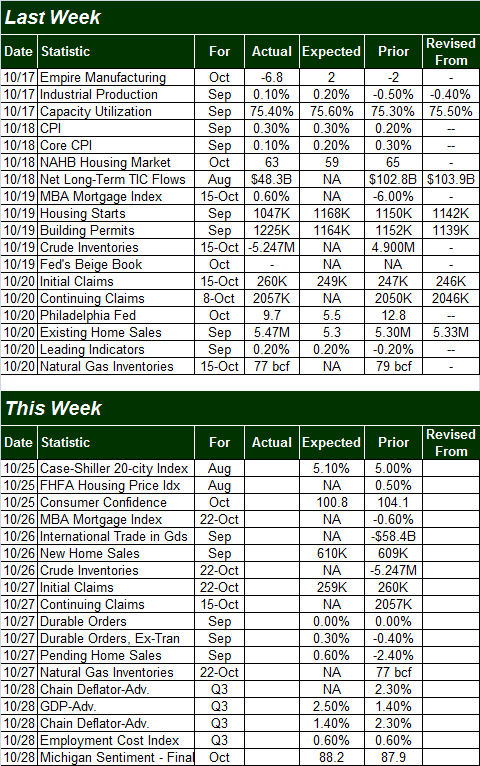
Source: Briefing.com
As was noted above, this week we'll hear about last month's new home sales, rounding out last week's report of existing home sales. Economists are looking for the pace of new home sales to edge just a tad higher, to 610,000 units, in step with the strong advance in the number of existing homes sold in September. Though a bit choppy for both data sets, the broad trend here remains impressive, perhaps held back by a sheer lack of inventory for new as well as existing houses.
New, Existing Homes Sales and Inventory Chart
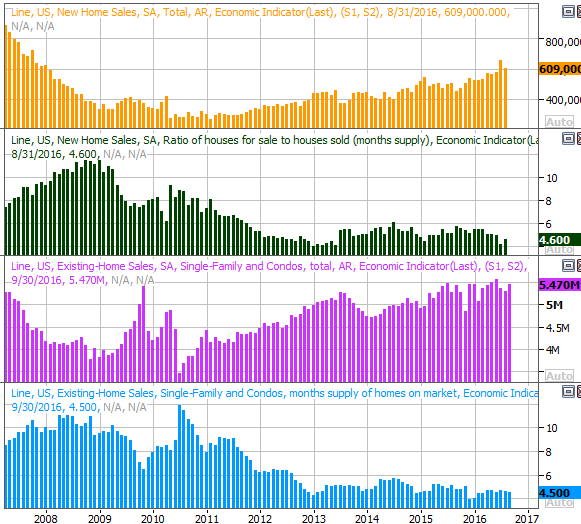
Source: Thomson Reuters
It's also going to be a big week for consumer sentiment measures, with the final reading on the Michigan Sentiment Index for October due on Friday, and the only consumer confidence reading from the Conference Board due on Tuesday. The latter is expected to fall, as is the former. Still, both remain in longer-term uptrends. Any slight pullback isn't necessarily a liability.
Consumer Sentiment Chart
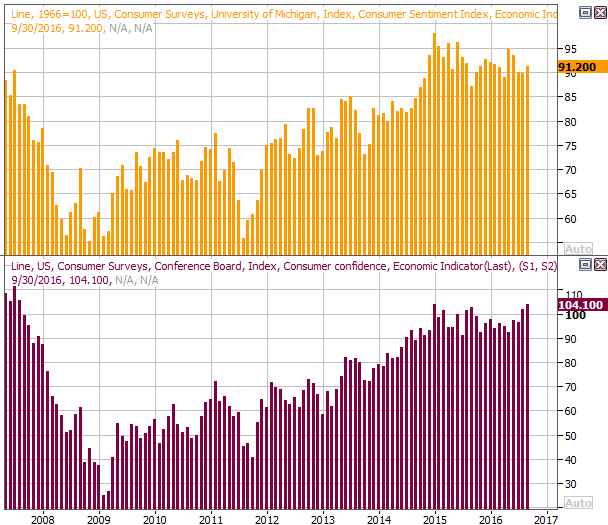
Source: Thomson Reuters
Finally, perhaps the announcement that has the most potential to move the market this week will be Friday's first look at Q3's GDP growth. The pros say it's going to be reignited, up 2.5%. That would be the best reading since the second quarter of 2015... the point where the oil meltdown (among other problems) became contagious, infecting other parts of the market.
GDP Growth Chart
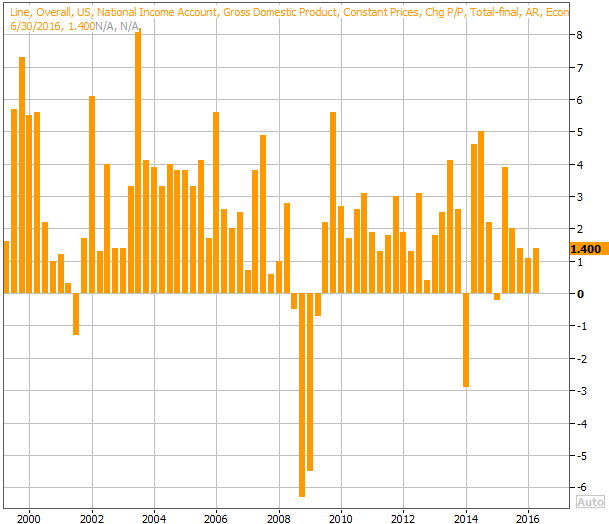
Source: Thomson Reuters
A reading that strong is a two-edged sword. While economic growth supports earnings growth, a strong reading here could also serve as the final reason the Fed needs to see to raise interest rates... which is intended to slow growth down as a means of quelling inflation. How the market responds will largely depend on how the matter is spun, if it does indeed roll in at the strong 2.5% growth pace.
Stock Market Index Analysis
As has been the case so often of late, the market ended last week between a rock and a hard place. That is, stocks remained above key support levels, but below important resistance lines.
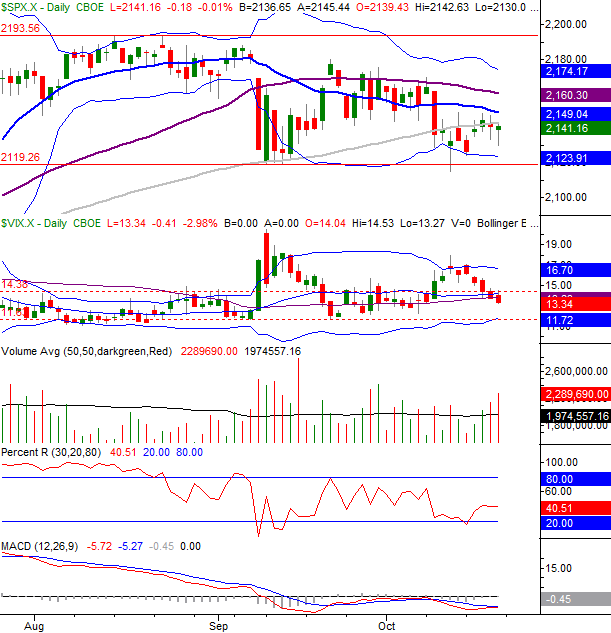
Nowhere is this more clearly evident than on a chart of the S&P 500 (SPX) (SPY). As you can see, the index continues to be held below the 20-day moving average line at 2149, but remains above a big floor at 2120... where the S&P 500 made lows in early September and where the lower Bollinger band will be this week. Notice, however, that we're on the verge of seeing the 20-day moving average line cross under the 100-day moving average line (gray) at 2143. If-and-when that happens, it will become much tougher for the index to break above either line; the bears will have the decisive momentum.
S&P 500 & VIX Daily Chart
Chart created with TradeStation
We can't come to any conclusions yet, however. The MACD lines are about to rekindle a bullish divergence, and the CBOE Volatility Index (VIX) (VXX) has broken under a floor around 14.0... and has room to run lower. On the flipside, we're seeing a whole lot more bearish volume than bullish volume of late, and we're seeing that bearish volume growing. The mixed messages are just a microcosm of the indecision that's kept things on ice since July.
Zooming out to a weekly chart of the S&P 500 we can see yet another lower high... the sixth one we've seen in the past nine weeks. It's also in this timeframe we can tell the index had gotten a little overheated in late June and early July, and is now paying that toll. Again though, there's a key floor -- and it used to be a ceiling -- around 2119. That's the line in the sand to watch.
S&P 500 & VIX Weekly Chart
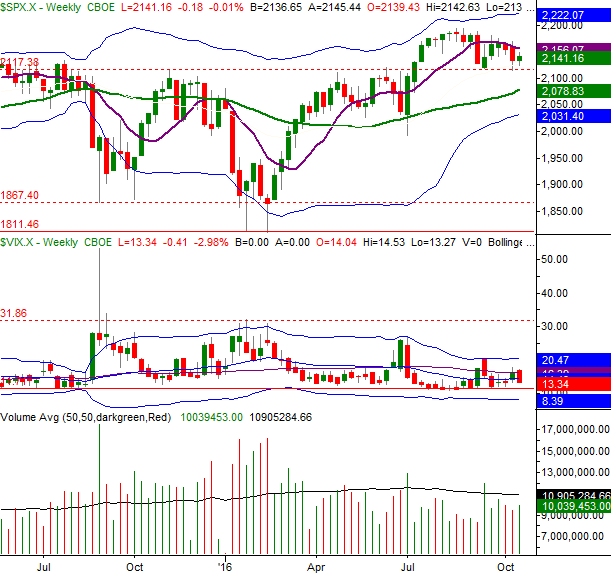
Chart created with TradeStation
Just to shake things up a bit and get a second opinion, let's switch gears and look at a chart ofthe Dow Jones Industrial Average (DJIA) (DIA)... not that it looks all that different. In this case the line in the sand is at 18,013, which was a floor in September but a ceiling several times during the first half of the year. The string of falling highs is even longer here.
Dow Jones Industrial Average Daily Chart
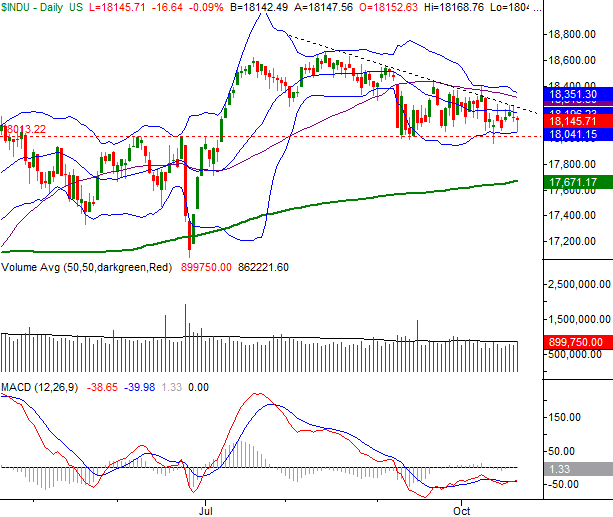
Chart created with TradeStation
With the market still on the fence and equally capable of going either way, the tool to watch here is the Percent R line on the S&P 500 daily chart above. It's back above the 20 threshold right now, but just barely. If it breaks back under the 20 line at the same time the S&P 500 edges to a new lower low, that would be a huge sell signal... at least for the near-term. That's a big "if" though.
Trade Well,
Price Headley
Disclosure: None.


