
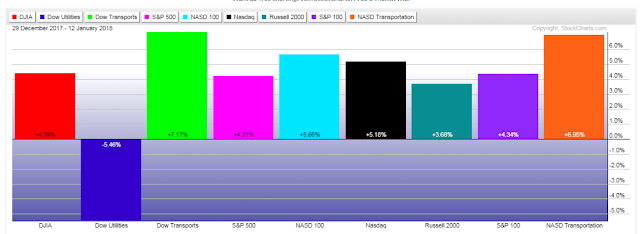
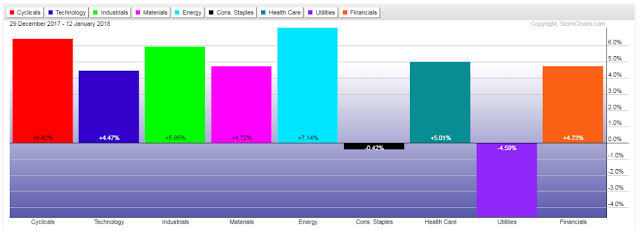
Volatility Rises As Major Indices & Sectors Extend Their Gains
As can be shown on the following Year-to-date percentage gained/lost graphs, U.S. Major Indices and Sectors extended their gains into Friday's close, except for Utilities and Consumer Staples.
However, they did so on rising volatility, as shown on the following SPX:VIX Daily ratio chart.
As I mentioned in my post of December 30, it will be important for price on this ratio to remain above 280 in support of a convincing argument that favours the entry of the SPX into a new bull-market phase, as shown on the following Monthly ratio chart.
It looks as though all 3 technical indicators are about to align and form a "SELL"signal on the daily timeframe. Watch for the RSI to drop and hold below 50, for a bearish crossover to form and hold on the PMO, and for the recent bearish crossover to hold on the MACD. Plus, if price holds below 280, we could see some weakness creep in on the SPX. Otherwise, we could see volatility drop, once more, while the SPX continues to rally.
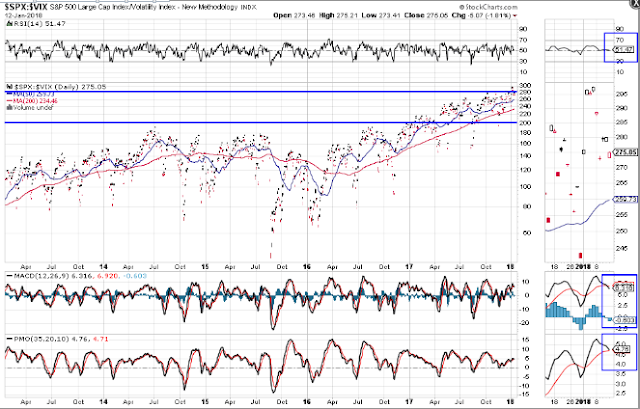
SPX:VIX Ratio DAILY

SPX:VIX Ratio MONTHLY


