
Valhi - Chart Of The Day
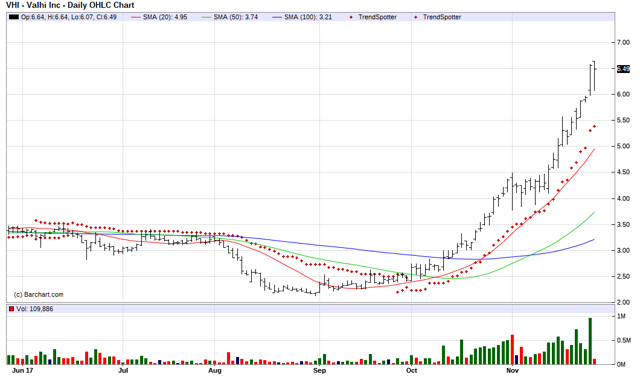
The Chart of the Day belongs to Valhi (VHI). Since the Trend Spotter signaled a buy in 10/2 the stock gained 140.45%.
Valhi Inc. operates through majority-owned subsidiaries or less than majority-owned affiliates in the chemicals, component products, waste management and titanium metals industries. These subsidiaries and affiliates are NL Industries, Inc., CompX International Inc., Waste Control Specialists LLC, and Titanium Metal Corporation.
(Click on image to enlarge)
Barchart technical indicators:
- 181.08+ Weighted Alpha
- 100% technical buy signals
- Trend Spotter buy signal
- Above its 20, 50 and 100 day moving averages
- 12 new highs and up 63.75% in the last month
- Relative Strength Index 76.86%
- Technical support level at 6.17
- Recently traded at 6.44 with a 50 day moving average of 3.74
Fundamental factors:
- Market Cap $2.23 billion
- P/E 10.80
- Dividend yield 1.35%
- Revenue expected to grow 9.20% next year
- Earnings estimated to increase 273.70% this year and compound at an annual rate of 25.50% over the next 5 years
- Although the one Wall Street analysts following the stock thinks it will under perform the market, the individual investors following the stock on Motley Fool voted 59 to 30 that the stock will out perform the market.
Disclosure: None.
How did you like this article? Let us know so we can better customize your reading experience.

Comments
Leave a comment to automatically be entered into
our contest to win a free Echo Show.

