
Top Five Buy/Strong Buy Upgrades - June 13, 2016
For today's bulletin we used our website's advanced screening functions to search for UPGRADES to BUY or STRONG BUY with complete forecast and valuation data. They are presented by one-month forecast return. JM Smucker (SJM) is the leader here. Note: there were only four upgrades to BUY/STRONG BUY with full valaution and forecast data for the day.
|
Ticker |
Company Name |
Market Price |
Valuation |
Last 12-M Return |
1-M Forecast Return |
1-Yr Forecast Return |
P/E Ratio |
Sector Name |
|
SMUCKER JM |
144.24 |
14.07% |
29.28% |
0.51% |
6.10% |
21.74 |
Consumer Staples |
|
|
SPECTRA EGY PTR |
46.44 |
-13.37% |
-4.27% |
0.58% |
6.89% |
12.15 |
Oils-Energy |
|
|
SENIOR HOUSING |
18.98 |
-17.94% |
5.50% |
1.16% |
13.93% |
10.02 |
Finance |
|
|
VEREIT INC |
9.81 |
-0.39% |
15.01% |
1.11% |
13.34% |
11.96 |
Finance |
|
|
N/A |
N/A |
N/A |
N/A |
N/A |
N/A |
N/A |
N/A |
N/A |
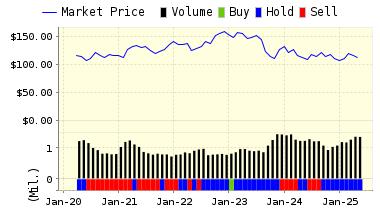
Below is today's data on JM Smuckers (SJM):
The J.M. Smucker Company, headquartered in Orrville, Ohio is the leading marketer of jams, jellies, preserves, and other fruit spreads in the U.S. They are also the leader in dessert toppings, natural peanut butter, and health and natural foods juice products, and market a wide variety of other specialty products throughout the U.S. and in many foreign countries. In the fruit spreads category, they also hold the leadership position in Australia and Canada.
VALUENGINE RECOMMENDATION: ValuEngine updated its recommendation from HOLD to BUY for SMUCKER JM on 2016-06-10. Based on the information we have gathered and our resulting research, we feel that SMUCKER JM has the probability to OUTPERFORM average market performance for the next year. The company exhibits ATTRACTIVE Company Size and Momentum.
|
ValuEngine Forecast |
||
|
Target |
Expected |
|
|---|---|---|
|
1-Month |
144.97 | 0.51% |
|
3-Month |
147.80 | 2.46% |
|
6-Month |
151.04 | 4.71% |
|
1-Year |
153.04 | 6.10% |
|
2-Year |
168.10 | 16.54% |
|
3-Year |
176.56 | 22.40% |
|
Valuation & Rankings |
|||
|
Valuation |
14.07% overvalued |
Valuation Rank(?) |
|
|
1-M Forecast Return |
0.51% |
1-M Forecast Return Rank |
|
|
12-M Return |
29.28% |
Momentum Rank(?) |
|
|
Sharpe Ratio |
0.65 |
Sharpe Ratio Rank(?) |
|
|
5-Y Avg Annual Return |
9.76% |
5-Y Avg Annual Rtn Rank |
|
|
Volatility |
15.11% |
Volatility Rank(?) |
|
|
Expected EPS Growth |
-3.02% |
EPS Growth Rank(?) |
|
|
Market Cap (billions) |
14.68 |
Size Rank |
|
|
Trailing P/E Ratio |
21.74 |
Trailing P/E Rank(?) |
|
|
Forward P/E Ratio |
22.42 |
Forward P/E Ratio Rank |
|
|
PEG Ratio |
n/a |
PEG Ratio Rank |
|
|
Price/Sales |
1.97 |
Price/Sales Rank(?) |
|
|
Market/Book |
2.00 |
Market/Book Rank(?) |
|
|
Beta |
0.53 |
Beta Rank |
|
|
Alpha |
0.09 |
Alpha Rank |
|
ValuEngine Market Overview
|
Summary of VE Stock Universe |
|
|
Stocks Undervalued |
56.65% |
|
Stocks Overvalued |
43.35% |
|
Stocks Undervalued by 20% |
24.73% |
|
Stocks Overvalued by 20% |
14.55% |
ValuEngine Sector Overview
|
Sector |
Change |
MTD |
YTD |
Valuation |
Last 12-MReturn |
P/E Ratio |
|
-1.05% |
4.55% |
34.74% |
9.94% overvalued |
17.51% |
29.09 |
|
|
-1.19% |
0.72% |
5.57% |
8.14% overvalued |
3.24% |
23.61 |
|
|
-1.48% |
0.39% |
6.13% |
5.69% overvalued |
3.31% |
23.41 |
|
|
-1.30% |
0.39% |
4.97% |
3.55% overvalued |
-8.93% |
18.09 |
|
|
-2.66% |
2.25% |
12.47% |
2.83% overvalued |
-31.42% |
22.35 |
|
|
-1.70% |
1.10% |
6.73% |
2.03% overvalued |
-9.71% |
21.78 |
|
|
-1.36% |
-0.59% |
-2.77% |
0.18% overvalued |
-2.78% |
18.87 |
|
|
-1.47% |
0.16% |
7.09% |
2.19% undervalued |
-9.90% |
27.82 |
|
|
-1.01% |
0.86% |
11.99% |
2.23% undervalued |
-9.97% |
22.92 |
|
|
-0.94% |
-0.53% |
1.90% |
3.23% undervalued |
-4.92% |
15.92 |
|
|
-1.31% |
-0.17% |
2.36% |
3.79% undervalued |
-11.55% |
22.48 |
|
|
-1.55% |
-0.58% |
19.60% |
4.59% undervalued |
-4.09% |
20.80 |
|
|
-1.76% |
0.26% |
-5.13% |
7.37% undervalued |
-21.92% |
26.89 |
|
|
-1.94% |
-2.07% |
-2.34% |
9.77% undervalued |
-18.36% |
11.88 |
|
|
-1.88% |
0.46% |
2.53% |
10.95% undervalued |
-26.12% |
13.54 |
|
|
-1.33% |
-0.29% |
-3.76% |
11.64% undervalued |
-12.09% |
22.00 |
VALUATION WATCH: Overvalued stocks now make up 43.35% of our stocks assigned a valuation and 14.55% of those equities are calculated to be overvalued by 20% or more. Seven sectors are calculated to be overvalued.
Disclosure: None.
Disclaimer: ValuEngine.com is an independent research provider, producing buy/hold/sell recommendations, ...
more

